


 169 / 218

[
] 167
Satellite observations of tropospheric nitrogen dioxide
Satellite instruments use spectroscopy to retrieve atmospheric
trace gas concentrations in the atmosphere. By comparing the
measured spectrum of the backscattered light from the Earth’s
atmosphere with a reference spectrum, the column density of
nitrogen dioxide along the light path can be determined. The
NO
2
stratospheric column is deduced from a chemistry-trans-
port model assimilation run of the NO
2
column data.
Subsequently, the assimilated stratospheric column is
subtracted from the retrieved total column, resulting in a
tropospheric column.
1
NO
2
has been monitored by satellite since 1995 with the
Global Ozone Monitoring Experiment (GOME), since 2002
with the Scanning Imaging Absorption Spectrometer for
Atmospheric Chartography (SCIAMACHY), and since 2004
with the Ozone Monitoring Instrument (OMI), the latter two
instruments having the advantage of a high spatial resolu-
tion.
The yearly averaged NO
2
column for 2005 as measured with
SCIAMACHY can be seen in the first image. It shows high
concentrations of NO
2
above highly populated regions like
Beijing, Shanghai, Hong Kong and South Korea. It can also be
seen that the satellite detects the emissions around the Yellow
River (Huang He). Over the sparsely populated western part of
China, low NO
2
concentrations are observed, except over the
large city Urumqi in the northwest.
Growth of NO
2
concentrations over China
The combined measurement series of both GOME and SCIA-
MACHY span almost a decade, which favours a trend analysis
of Chinese emissions. To do this, the averaged monthly
tropospheric NO
2
columns are fitted with a linear model that
also includes a sinus to represent the seasonal variation of
NO
2
.
Seasonal variation is mainly determined by the changing day
length over the year. In the absence of sunlight NO
2
has a
longer lifetime in the atmosphere, which explains why the NO
2
columns are higher on average during wintertime. The second
image shows the derived annual growth in the tropospheric
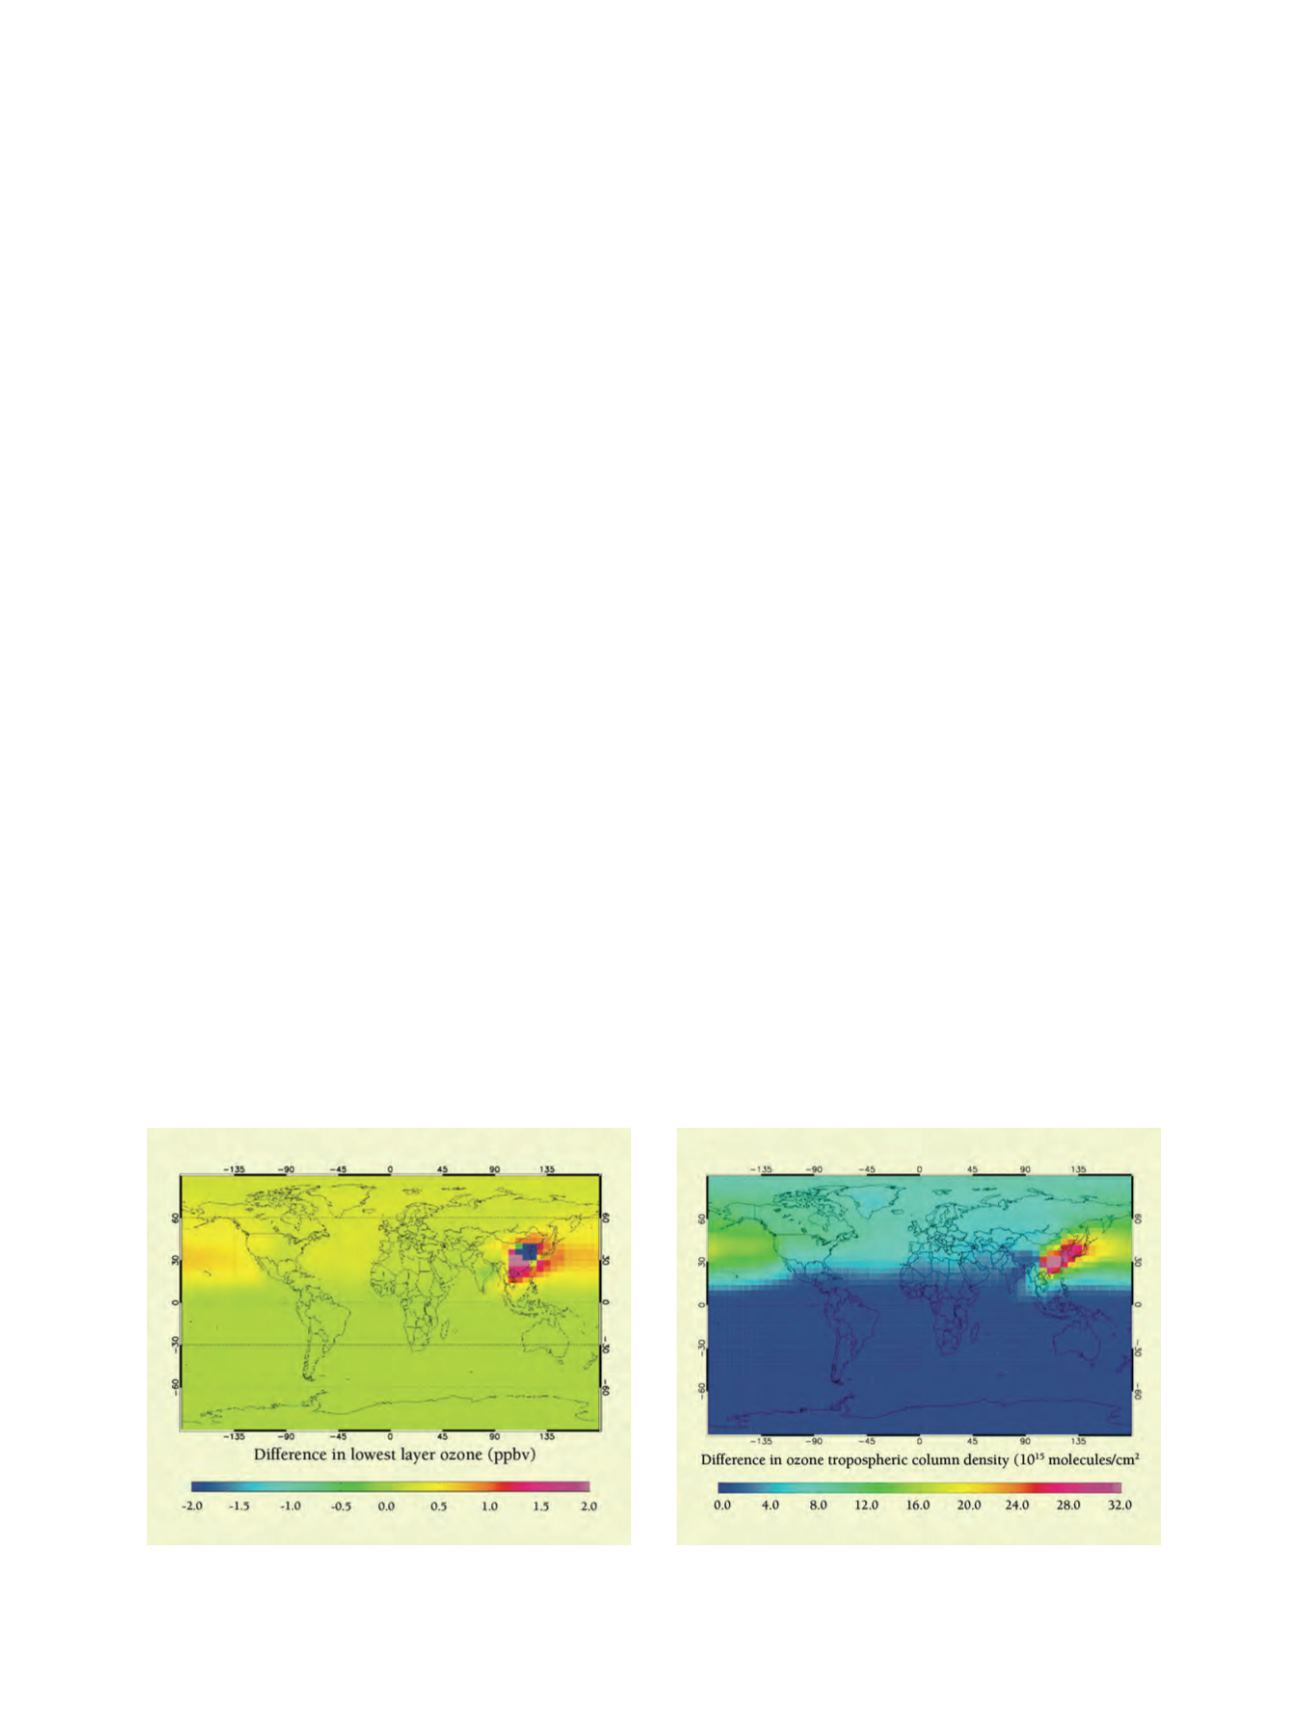
The difference in ground-level ozone caused by the increase of
Chinese NOx emissions between 1997 and 2005
Source: KNMI
The increase in tropospheric ozone columns caused by rising
Chinese NOx emissions between 1997 and 2005
Source: KNMI
NO
2
columns from this analysis. The highest trend is found in
east China, where economic growth is faster. The fastest
growing city with respect to both economy and tropospheric
NO
2
is Shanghai.
2
Global implications
The fast growing emissions in China lead locally to rapidly
increasing NO
2
concentrations, which affect local ozone
concentrations. Clearly these large increases will have severe
consequences for local air quality, but effects on a global scale
can be expected, because the lifetime of tropospheric ozone is
much longer than the lifetime of NO
2
.
Therefore, ozone can be transported over large distances
by the wind. Using a chemical transport model the change in
ozone due to increasing emissions in China can be calculated.
The image below shows increasing ozone concentrations in
the northern hemisphere caused by growing Chinese emis-
sions in the period 1997-2005. In this period of eight years
the global averaged tropospheric ozone column has increased
by 0.54 per cent. The largest growth in tropospheric ozone is
found in a plume reaching from China to the east along the
direction of the prevailing winds. From this image, we
conclude that the tropospheric ozone concentrations in the
entire northern hemisphere are increased due to the growing
emissions in China. These increases seem small, but are still
important. In Europe, air pollution has been increased as a
result of intercontinental transport. In addition, since ozone
is a strong greenhouse gas, the effects on climate change
cannot be neglected.
A decade of satellite observations of nitrogen dioxide in the
atmosphere has been used to find trends in emissions in China.
As expected, the nitrogen dioxide concentration is growing
most rapidly in east China, where there is the most economic
growth. By feeding the derived trends to a global chemical
transport model of the atmosphere, the effects on the concen-
trations of the worldwide tropospheric ozone can be
determined. According to the model, the background concen-
tration of ozone has been increased in the entire northern
hemisphere as a result of the growing emissions in China.