


 182 / 196

[
] 180
Flood damage statistics – such as the length of rail, roads, or extent
of crop area under submergence – are also transmitted to the deci-
sion makers. The spatial inundation map, along with estimates on
submergence, is generated within eight to ten hours of receiving
satellite data and disseminated to the Ministry of Home Affairs, the
Central Water Commission and State Relief Commissioners through
electronic means for further use in relief and rescue operations. There
is also a systematic feedback mechanism, through which decision
makers are able to interact with the DSC to get the required value
addition to the information.
Through the analysis of historic satellite images, a flood frequency
map is prepared showing the frequency of flooding and the extent of
inundation. Based on these maps, flood hazard zones are delineated
and updated under each river system. Flood hazard zones indicate
vulnerability and risk, and hence are useful in evolving long-term
structural and management measures for risk reduction. The infor-
mation on river configuration changes, riverbank erosion/deposition,
and the status of flood control structures is generated periodically
using multi-temporal and multi-resolution satellite data.
4
This infor-
mation plays a vital role in designing structural flood mitigation
measures.
Timely dissemination of information to user departments is
achieved through a dedicated satellite-based communication
network. This network operates on an extended C-band onboard
INSAT system and has facilities like video conferencing, voice over
Internet protocol and large-volume data transfer. It is connected with
state disaster emergency operation centres and key government
offices across the country that are engaged in disaster management
and knowledge institutions.
There are also plans to generate finer resolution digital
elevation maps from Airborne Laser Terrain Mapper
(ALTM) instruments, which are useful for accurately
assessing the depth of flooding – a crucial input for
flood risk assessment. The proposed launch of state-of-
the-art indigenous microwave satellite RISAT, in the year
2009, will further boost the use of space images for
disaster management.
Agricultural drought
Agricultural drought assessment using space technology
has been operational in India since 1989 through the
project National Agricultural Drought Assessment and
Monitoring System (NADAMS). NADAMS provides near-
real-time information on prevalence, severity level and
persistence of agricultural drought at state/district/sub-
district level. Currently, the project covers 13 states of
India. Coarse resolution data from AVHRR is being used
for drought assessment at regional and district level.
Moderate resolution data from Advanced Wide Field
Sensor (AWiFS) and Wide Field Sensor (WiFS) from
Indian remote sensing satellites is used for detailed assess-
ment of agricultural drought at sub-district level in four
states.
5
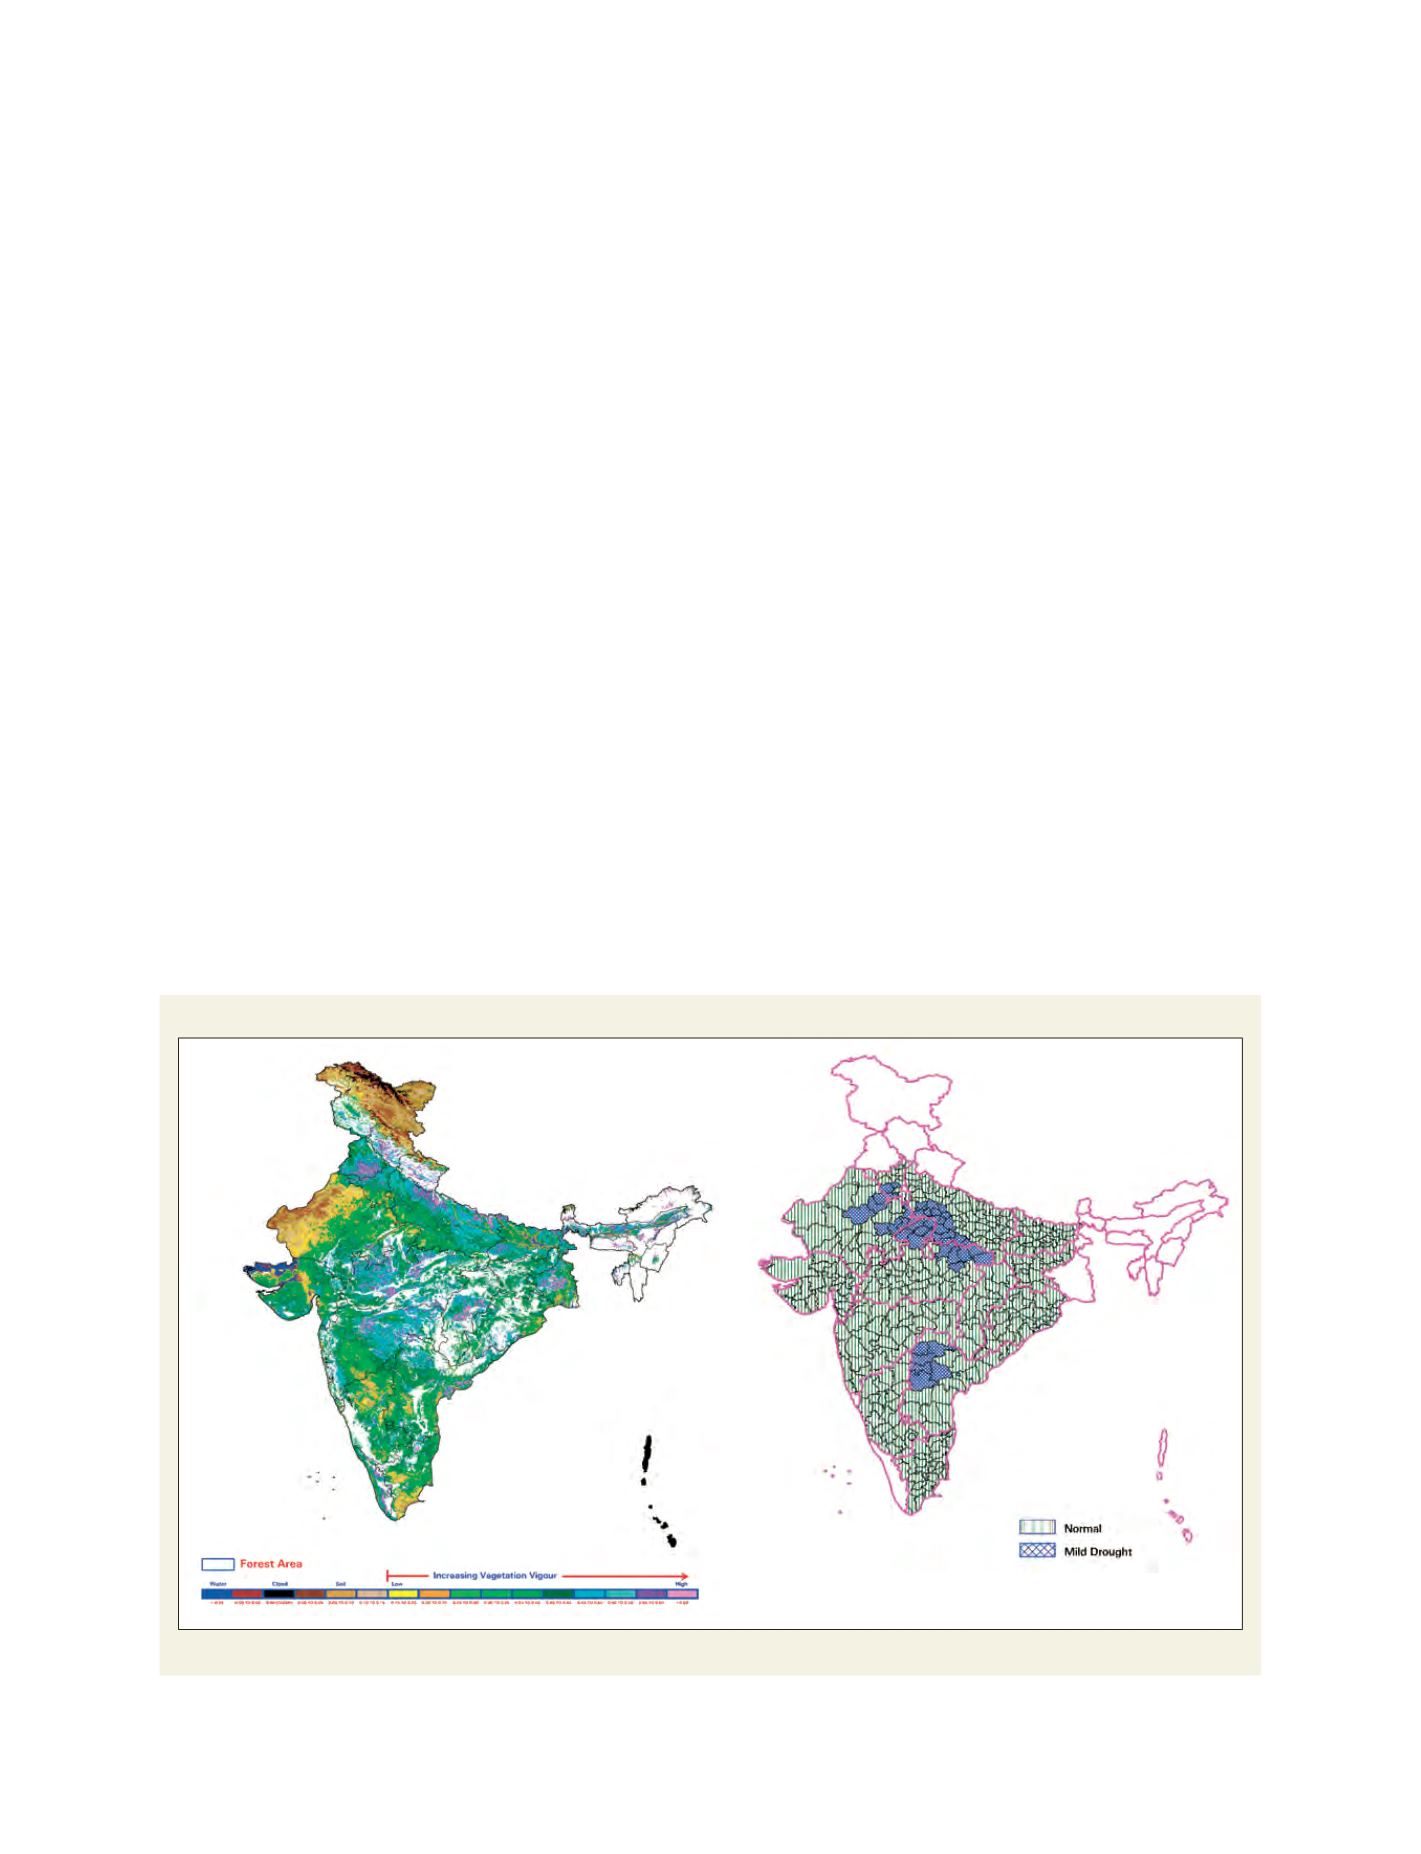
The satellite-derived Normalized Difference
Vegetation Index (NDVI) and other biophysical para-
meters are integrated with ground data on soils,
irrigation, rainfall and crop areas for assessing the agri-
cultural drought situation. During June to August,
Agricultural drought assessment
Left: NOAA AVHRR NDVI September 2007; Right: Drought intensity
Source: NADAMS drought reports of 2007, NRSA, India