


 242 / 280

[
] 242
change in rangeland condition over a ten-year period
(1989–1999), as judged by local experts.
Besides land degradation, other forms of land cover and land
use change (e.g. expanding subsistence agriculture or informal
settlements) as well as natural processes can also cause a reduc-
tion in production per unit of rainfall. The present method should
thus be used as a regional indicator to identify potential problem
areas that can then be investigated in greater detail, using high-
resolution remote sensing data and field data. It is unlikely that
any method that depends exclusively on remote sensing from a
single sensor will be able to unequivocally map the complex
ecological process of degradation. Maps depicting the trends in
vegetation production per unit of rainfall, as shown here, require
field verification before management and policy decisions can be
based on them. The Department of Agriculture is therefore
actively involved in the verification process. In contrast to previ-
ous maps of land degradation in SA that were mainly based on
expert opinions, the remote sensing approach is objective and
repeatable, and all indications are that it will furnish a valuable
regional monitoring tool.
The long-term, high temporal resolution, satellite data that are
being promoted by GEOSS are indispensable, and significant efforts
are in progress to improve the quality of the data. The AVHRR instru-
ments were never intended for the uses to which they are now put
and the quality of the data, while appropriate for the original appli-
cation in weather forecasting, are not optimal for remote sensing of
vegetation. Newer sensors such as MODIS are now in service, but
these are experimental systems, not intended for long-term opera-
tional observations. Thus the role of GEOSS in encouraging
long-term data collection is very important in the context of mapping
and monitoring desertification.
Photo: K Wessels
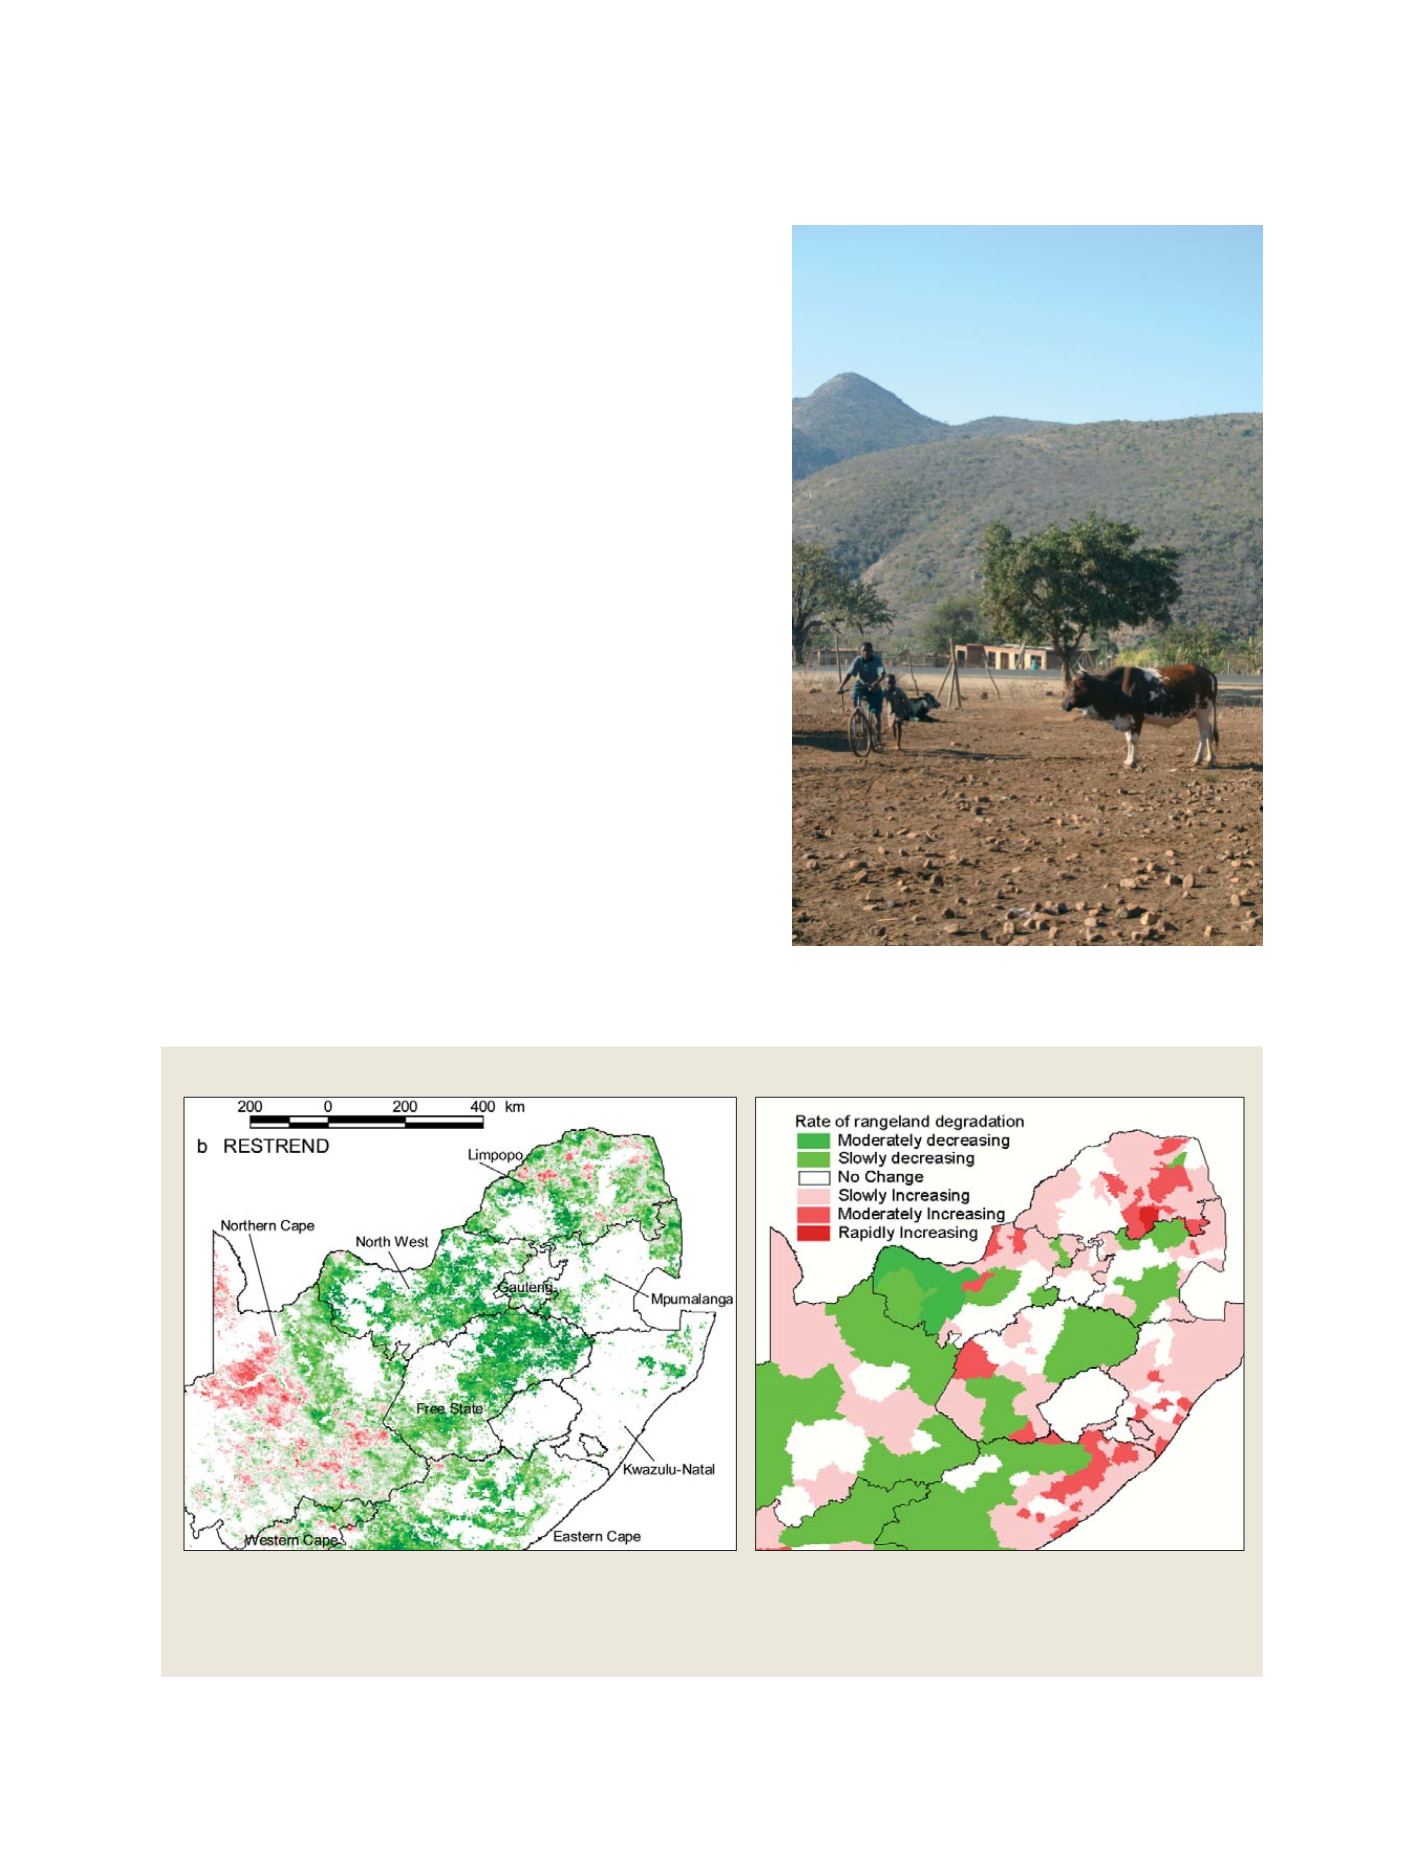
Degradation continues to threaten the local resource base upon
which rural communal livelihoods depend
Trends in vegetation production per unit of rainfall
Left: Temporal trends in vegetation production per unit of rainfall in the summer rainfall region of South Africa
(red – negative, green – positive) derived with NOAA AVHRR data from 1985 to 2003. Right: The rate of rangeland
degradation as judged by experts (after Hoffman et al. 1999). The two maps agree in many parts of the region.
Note the high spatial resolution of the satellite observations
Source: K Wessels
S
OCIETAL
B
ENEFIT
A
REAS
– E
COSYSTEMS