


 251 / 280

[
] 251
derive huge support from the development of a standardized Global
Earth Observation System of Systems (GEOSS).
Remote sensing water monitoring for sustainable agriculture
Water stored in reservoirs is vital for industry, agriculture and human
consumption. Altimeter data is commonly used to monitor reservoir
heights. Remote sensing satellite data is also useful for monitoring
reservoirs and snow cover during the winter months. It can aid in the
prediction of future reservoir levels and is used to visually monitor
reservoir levels.
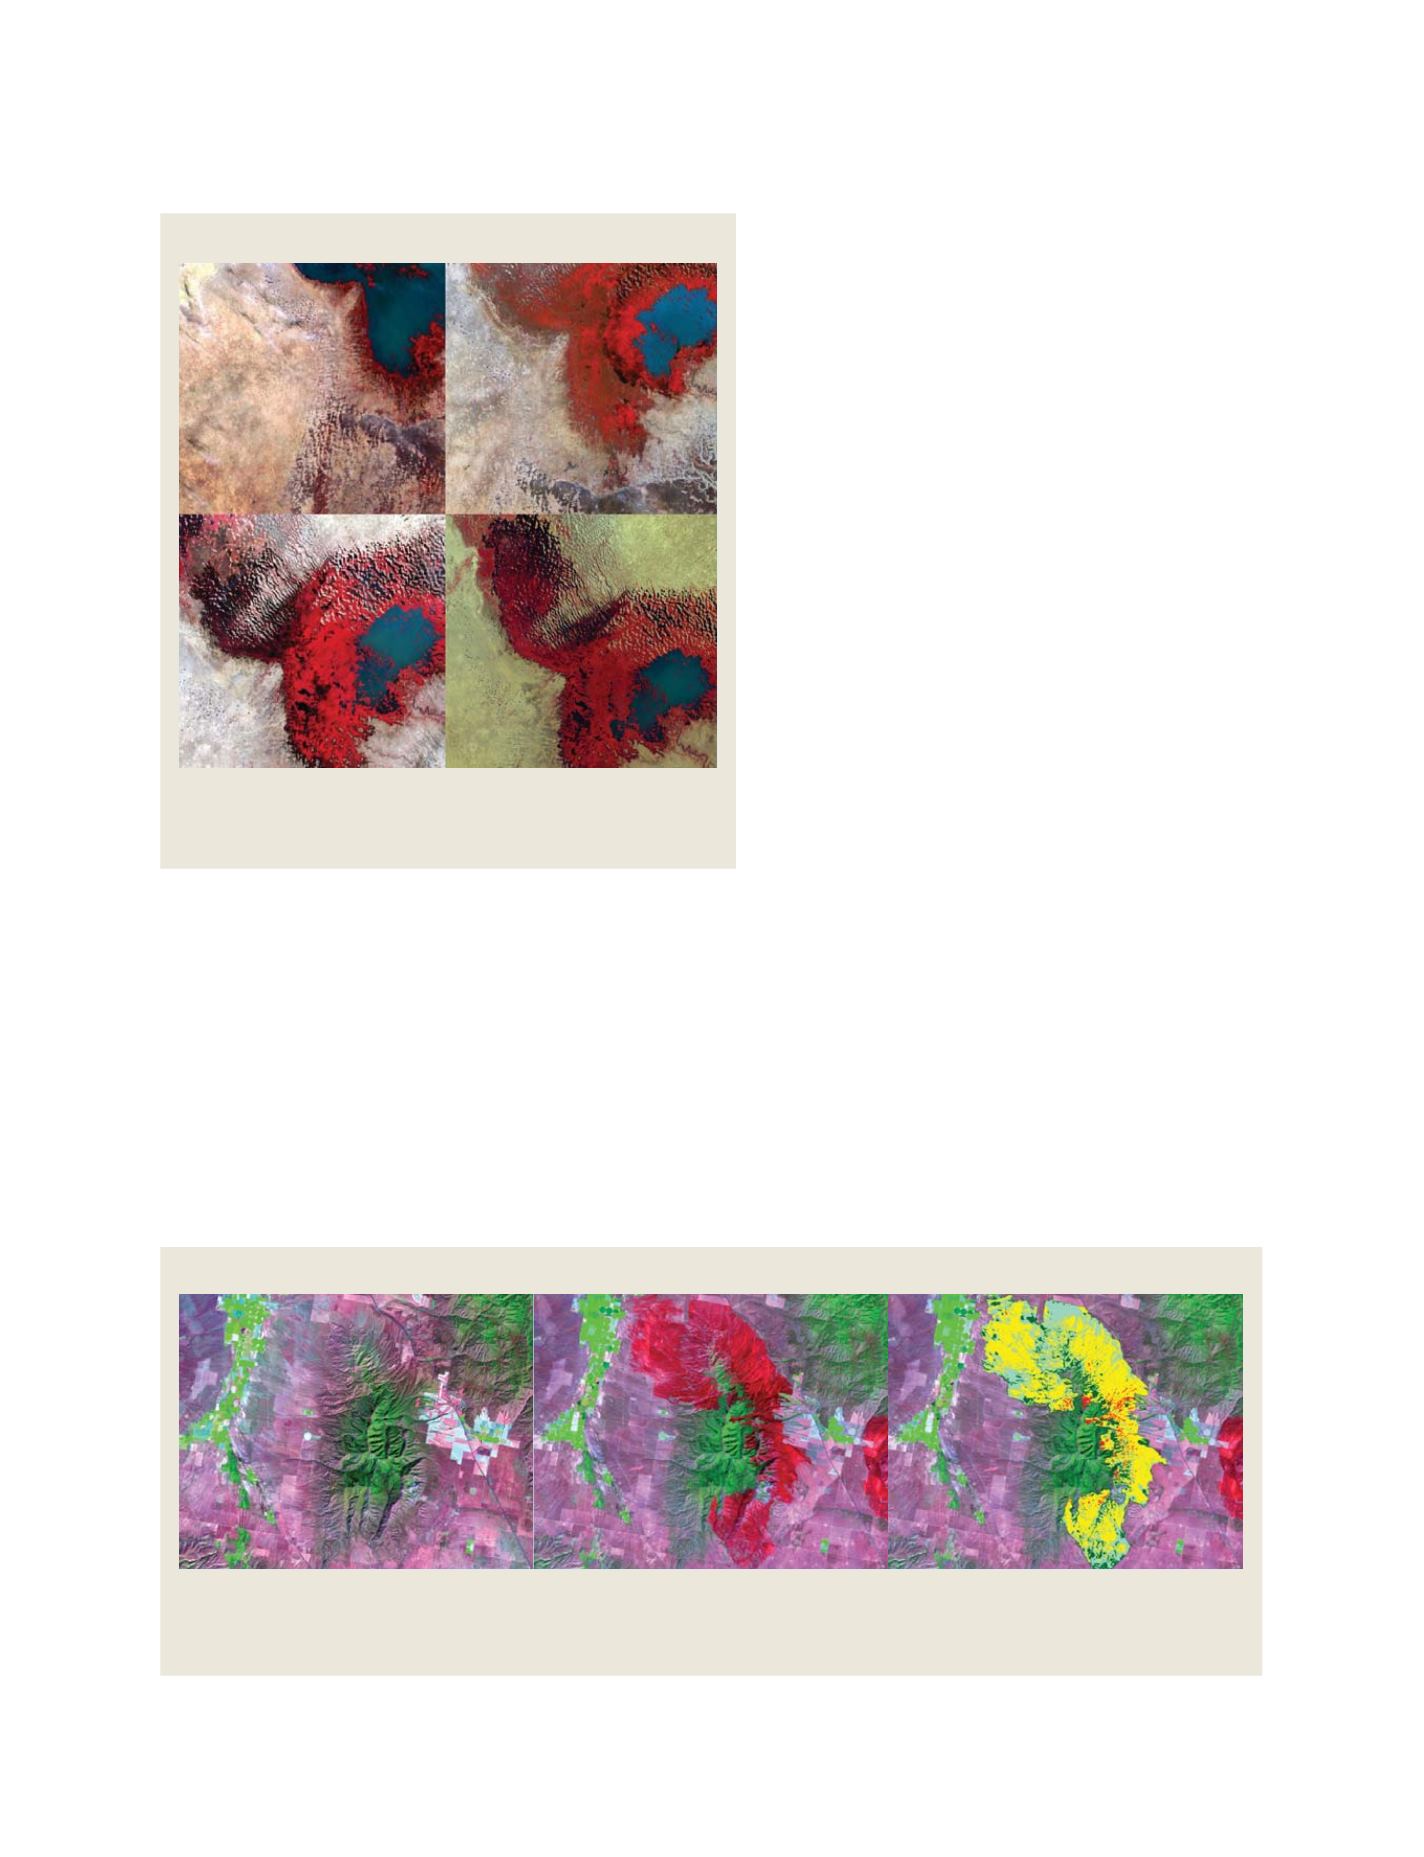
On the edge of the Sahara, the world's largest, driest
desert, there lies a large freshwater lake called Lake
Chad. It borders four countries in West Africa: Nigeria,
Niger, Chad, and Cameroon. Lake Chad was once the
sixth largest lake in the world (approximately 26,000
square kilometres in early 1960’s), but persistent drought
since the 1960s shrank it to about one tenth of its former
size. Lake Chad was once the second largest wetland in
Africa, highly productive, and supporting a diversity of
wildlife.
After the extended drought of the 1970s and mid-
1980s, the lake shrunk to less than 3,000 square
kilometres, and the Chari and Logone rivers, which
contribute more than 80 per cent of the total water
supply for Lake Chad, were reduced to a trickle.
Throughout Landsat was used to monitor the process.
Remote sensing thermal data, such as that obtained
from the Landsat satellite, can be used to determine
evapotranspiration (ET), measure and monitor agricul-
tural water use and evaluate climate change. An
energy-balance
model,
such
as
Mapping
Evapotranspiration with high Resolution and
Internalized Calibration (METRIC), can compute ET
directly from Landsat images. METRIC is used to: map
ET by land use/land cover type, compute aquifer deple-
tion from irrigation, compute a water balance
foreground water models, and compute consumptive
water use by irrigated agriculture.
Integrating multiple sources of timely multi-spatial -
spectral and -temporal imagery with agrometeorological
provides valuable information for monitoring global
agricultural conditions. The USDA Foreign Agricultural
Service and other US and international agencies draw
on imagery, data and capabilities from many other agen-
cies and departments to make forecasts on global
agricultural production and yields.
Wildland fires prevention and recovery
Sustained use of Earth observation data as a function of
Landsat image clips - 8 December 1972 Landsat 1 image, 14 December
1987 Landsat 4 image, 18 December 2002 Landsat 7 image, and
8 February 2007 Landsat 7 image
Lake Chad shrinkage
Satellite Imagery, such as the Landsat 5 Thematic Mapper
TM
scenes shown here, is used to rapidly create a burn index classification which is combined
with other geospatial data including soils, hydrology GIS layers, and field inventory data. The final product is a map showing high priority areas for fire
risk and erosion control treatments. The images above are for the Black Pine 2 fire located near Malta, Idaho USA in the Sawtooth National Forest.
Left: Pre-fire image (13 August 2005); Centre: Post-fire image (18 August 2007); Right: Burn index classification
Landsat 5 Thematic Mapper
TM
in support of BAER classification map
Source: USGS Center for Earth Resources Observation and Science
Source: Jess Clark, USDA Forest Service Remote Sensing Applications Center
S
OCIETAL
B
ENEFIT
A
REAS
– A
GRICULTURE