


 254 / 280

[
] 254
A specialized application for identification of phyto-
plankton using EO is in the aquaculture sector. Here,
the occurrence of blooms of certain phytoplankton is
antagonistic to the industry. Such outbreaks are referred
to as Harmful Algal Blooms (HAB). Some species of
phytoplankton are dangerous for culture of salmonids
because the cells tend to clog the gills of the fish. Others
produce toxins which may accumulate in the tissue of
bivalve molluscs that feed on them. Consumption of
shellfish containing these toxins may be fatal to people.
Sometimes, phytoplankton that are otherwise not
dangerous may become so because, having reached high
abundances through vigorous growth under favourable
conditions, they may die and decay when conditions
become unfavourable, consuming oxygen such that the
environment may be rendered disadvantageous for aqua-
cultured species. It is clear that the aquaculture industry
can benefit from the information provided by EO
to determine the onset, extent and fate of phytoplank-
ton blooms.
The fishery for cultured pearls is also vulnerable to
environmental conditions, in this case to the effect of
excessive sediment deposition over the oyster beds.
Fortunately, the movement of sediments by coastal
currents can be monitored by EO, alerting growers to
the potential threats following storms or heavy rains.
The ocean ecosystem is not everywhere the same.
Rather, it is organized into a suite of more-or-less
autonomous subsystems loosely connected to each
other. We may call these systems ecological provinces.
Informed stewardship of the ocean requires that we
understand the organization into provinces and that we
in this regard: it can give excellent spatial resolution, high repeat
frequency and is very cost-effective. We can expect therefore that
EO will be an important contributor to the development of an
optimal set of ecological indicators for operational use in the ocean.
Ecosystem seasonality provides a good example. In temperate lati-
tudes, a pronounced peak in chlorophyll concentration in spring is
typical. It is such an important event in the ecological year that many
species of fish and invertebrates, including those of economic inter-
est to fisheries, time their reproduction to take advantage of it. At a
particular location, the timing of this peak in particular years will
vary by a few weeks depending on the weather. These fluctuations
may have profound effect on the survival of the offspring, to the
extent that the success or failure of the year class in a particular year
maybe determined by them.
Images of chlorophyll distribution obtained by EO may also be
used directly in fishing. It is often found that local concentrations
of fish are related to typical oceanographic structures that can be
recognized by EO. In India, artisanal fishermen are supplied regularly
with analysis of EO imagery as an aid to their work. The intent here
is not to overexploit a stock that might already be under heavy fishing
pressure. Rather, the purpose is to help the fishermen complete their
work with a minimum of searching time and a corresponding saving
in fuel.
An important refinement of the interpretation of data from EO of
ocean colour is to determine the quality as well as the quantity of
plant biomass in the ocean. In the simplest case, all the chlorophyll
is treated as a single pool of biomass. But in fact, there is a very large
number of species of phytoplankton in the sea, representing several
major taxonomic groups. These have different roles in the chemical
cycles of the ocean, and also different values as potential food sources
for organisms that feed on them. One of the contemporary goals of
ocean-colour science is to be able to determine the presence and
abundance of these different groups by EO. A major advance in this
direction is the algorithm that detects the presence of the important
group of phytoplankton known as the diatoms.
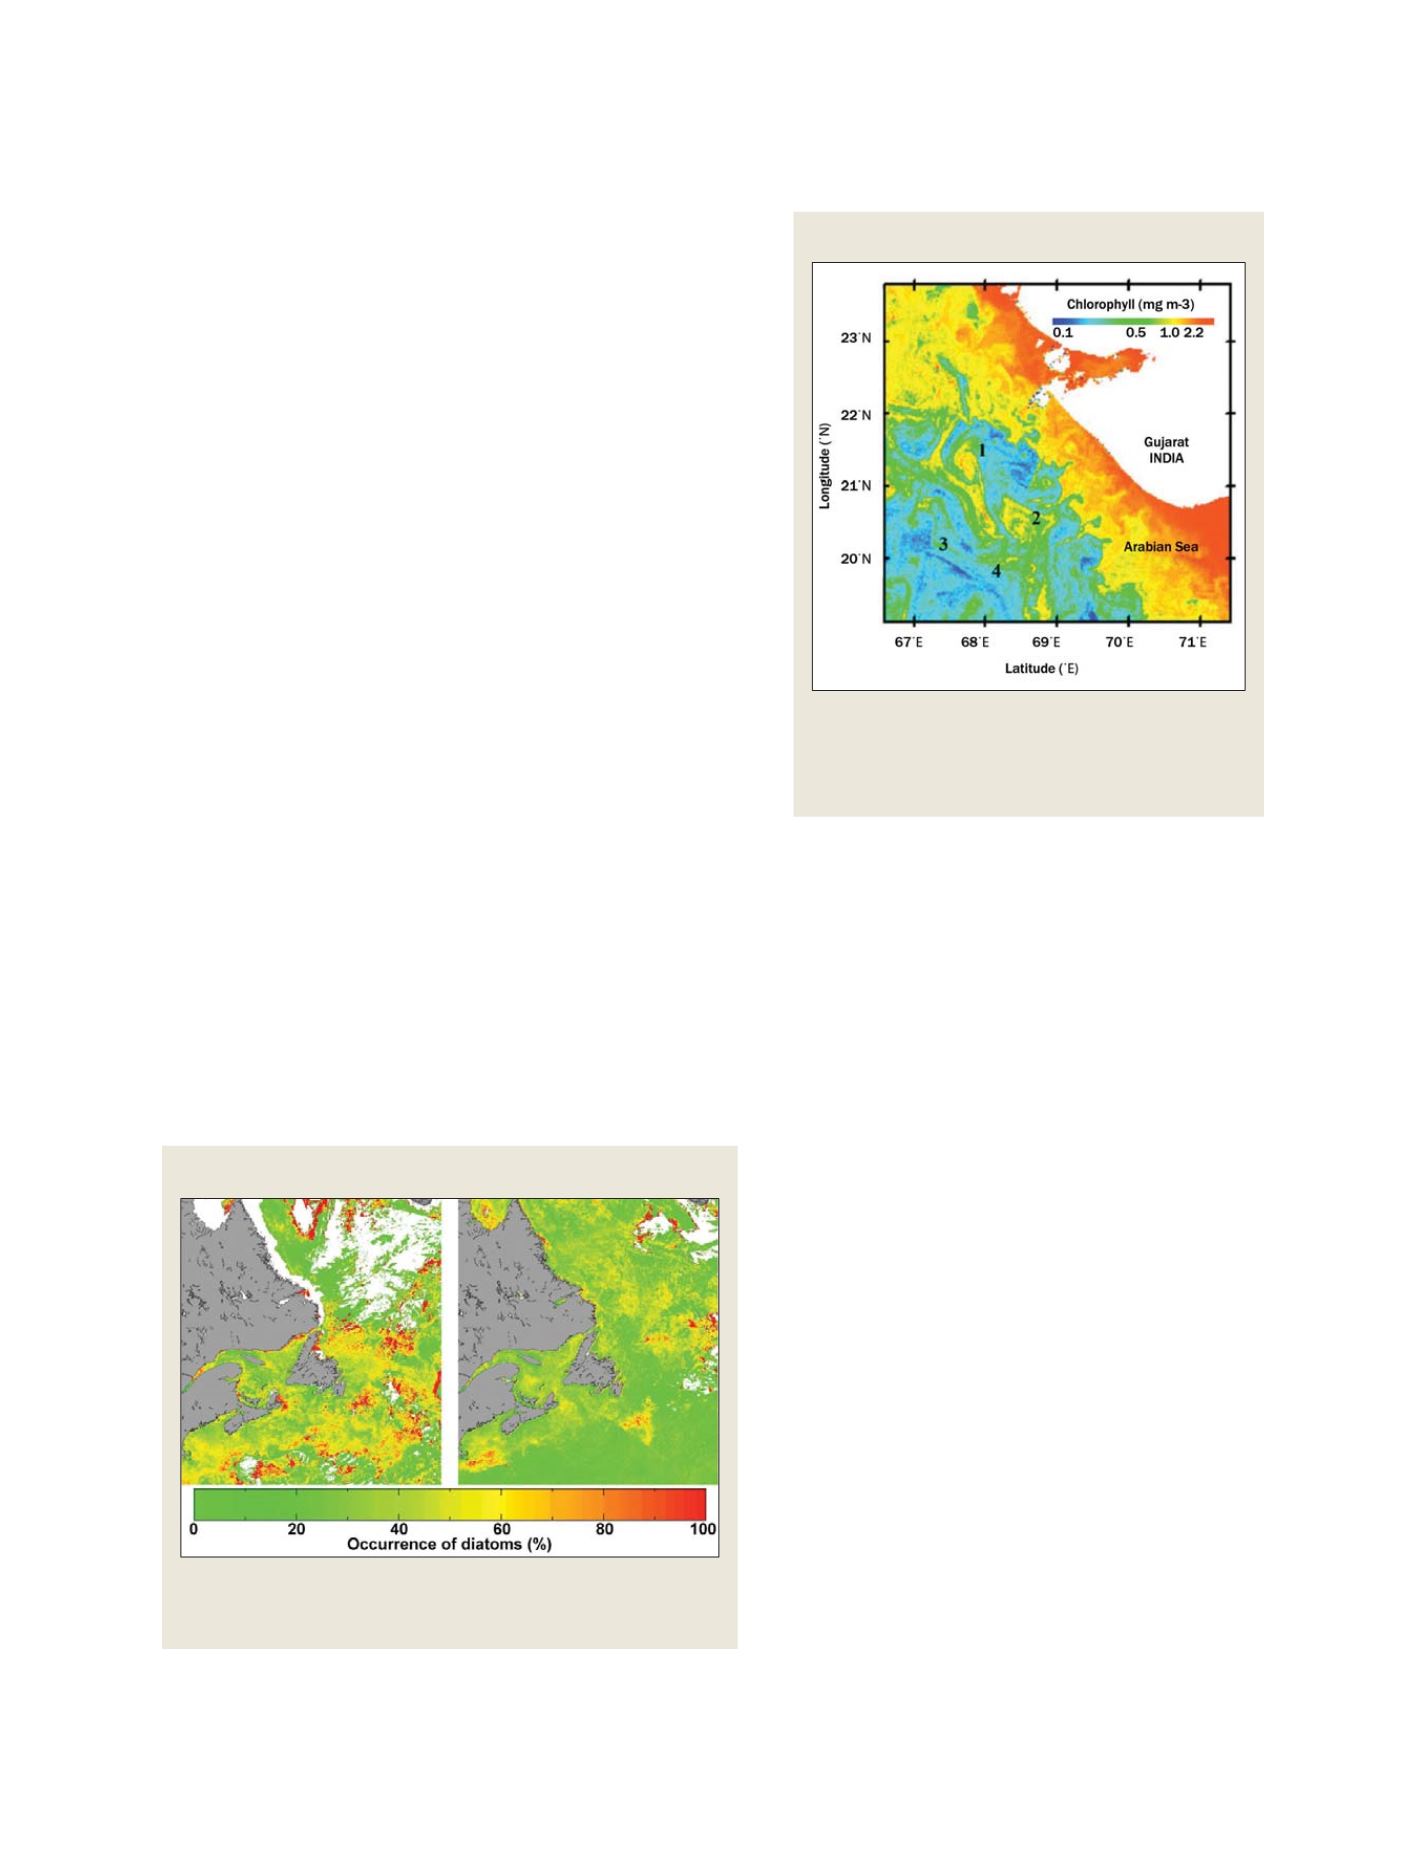
Chlorophyll image of northwestern India
This chlorophyll image of northwestern India on 29 February
2006 was generated from the Indian OCM sensor. Oceanic
features such as cyclonic eddies (1 and 2 on the image) and
fronts (3 and 4) are known to be productive sites, and are
hence relevant for fishery exploration
These satellite-derived maps show the probability of the occurrence of
diatoms in the Northwest Atlantic Ocean during spring (16-30 April, left) and
summer (1-15 July, right) of 1999
Diatoms
Source: R.M. Dwivedi, Indian Space Research Organisation, India
Source: Shubha Sathyendranath and Emmanuel Devred, Bedford Institute of
Oceanography, Canada
S
OCIETAL
B
ENEFIT
A
REAS
– A
GRICULTURE