


 250 / 280

[
] 250
and feed the models and decision support tools.
When performing analysis of agricultural disasters, it
is extremely important to have imagery just before and
just after the disaster occurs. Unlike assessing damage to
structures, assessing damage to field crops is much more
of a ‘moving target’. Crops are harvested; one day corn
is in the field, the next day it is on the way to the market.
Meaningful change detection is extremely important in
estimating losses and the market impact of disasters.
For example, on 15 July, 2007 a severe storm with hail
and wind damage occurred affecting Cass County, North
Dakota and its neighbouring counties. The NASA
Moderate Resolution Imaging Satellite (MODIS) data
subsets gave the initial view of the damage areas.
Imagery from NASA’s MODIS sensor can provide twice
daily coverage at 250m resolution. However, a 250m
pixel is limited to gathering crop information for rela-
tively rectangular fields larger than 25 hectares. Using
two opportunities per day greatly increases, but does
not guarantee, that cloud free imagery of the area of
interest will be available every week.
The presence of clouds can be mitigated by creating
composites using maximum Normalized Difference
Vegetation Index (NDVI) values and cloud screening
algorithms to filter out clouds. The SPOT-VEG NDVI
product is created every ten days using composite
imagery from the vegetation sensor onboard the
SPOT-4 satellite.
After creating a time series of NDVI composites, prod-
ucts can be generated that compare the current ten-day
composite from an average year, or compared to last
year’s image, thus establishing whether this year’s crop
is better or worse than last year. Care needs to be taken
not to infer too much from this single data visualization
without understanding cloud contamination and other
weather factors.
There are many way to use remote sensing dataset to
help quantify the environment impacts and support local
and international agricultural sustainment programs.
The key component is global, usable data, which would
images, along with other data sources, to develop timely, unbiased
global crop production estimates. These images are derived from
energy reflected off objects on the earth’s surface and picked up and
recorded by satellite sensors. Energy reflected off vegetation is
distinct from that of other objects, and it is this that renders remote
sensing so useful to agriculture. In their photosynthesis process,
plants reflect an abnormally high amount of infrared energy. This
gives vegetation a unique ‘fingerprint’ or signature that can be
measured by sensors and formed into a picture or image.
In typical false colour images red signifies plant biomass, so that
the more red that there is in the image, the more dense and healthy
the vegetation. The green or gray areas represent dry or bare fields,
which may or may not be planted with yet-emerged summer crops.
Cultural features such as roads and towns are also visible and appear
dark blue. Landsat allows a more thorough analysis, providing spatial
detail and accuracy assessment impossible with lower resolution,
meteorological satellites. Satellite imagery is one of many tools used
by USDA’s foreign agricultural service in its ‘convergence of evidence’
approach towards global crop monitoring.
Remote sensing and crop disasters
Producers can make all the right crop-related decisions, but a single
disaster can nullify their whole investment. Unfortunately, crop
related disasters and crop failures are far too common. Such events
can have a massive impact on local food supplies and the local
economy, the national food security and economies, and global food
supplies. To help solve this difficult problem, proper remote sensing
monitoring data, satellite, aerial, and in situ, are needed to develop
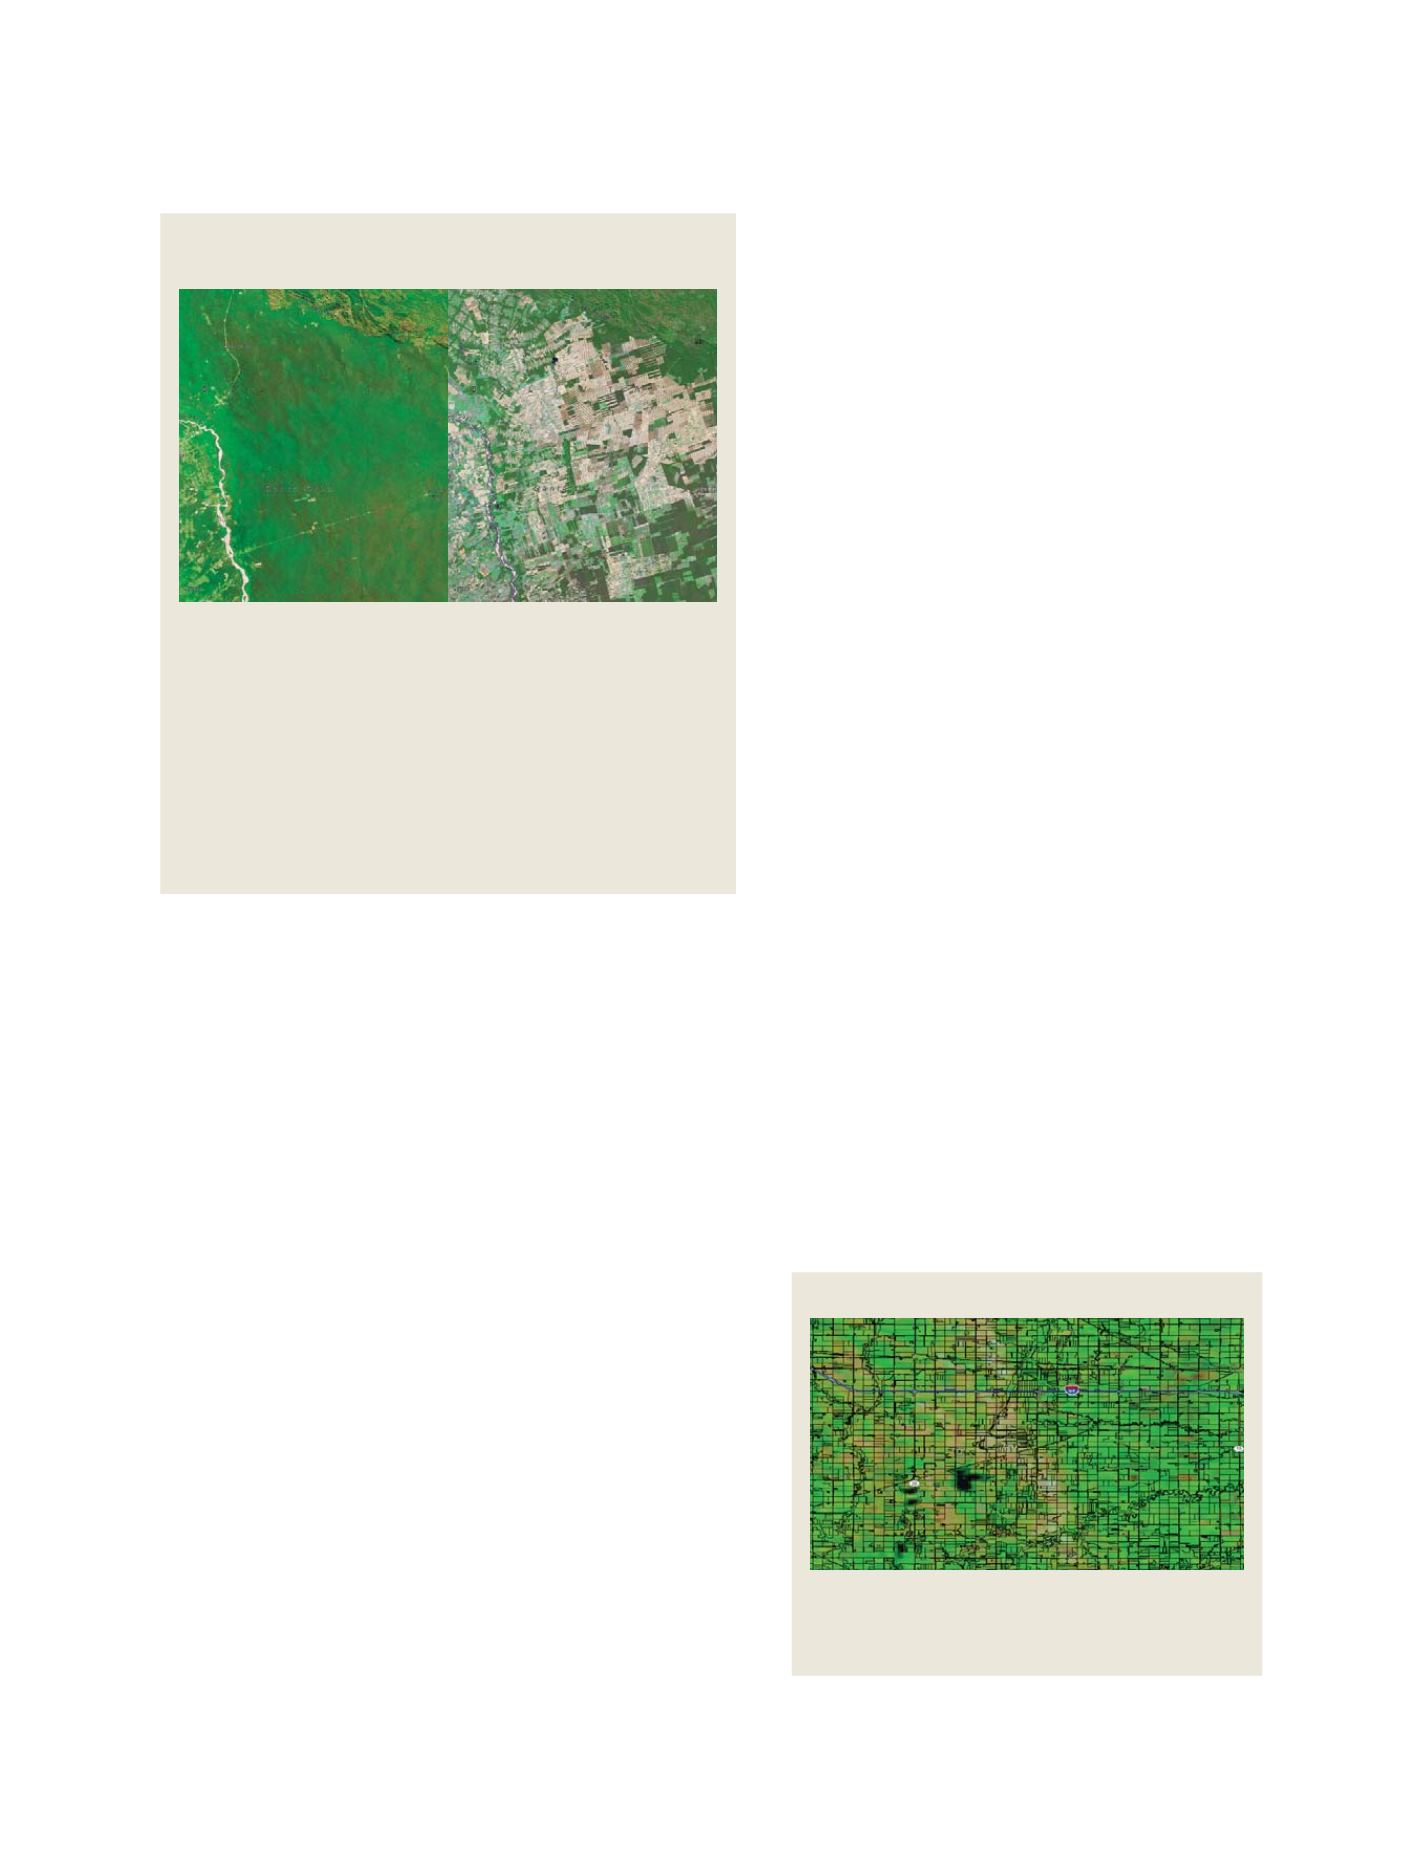
Landsat 5 MSS and Landsat 7 ETM+ images of agriculture
development in Santa Cruz de la Sierra, Bolivia, 1975 - 2003
These two images show an area of tropical dry forest located east of Santa
Cruz de la Sierra, Bolivia. They demonstrate information that is vital to the
evaluation of sustainable agriculture, vulnerability to climate change, and the
social and economic impacts of agriculture and land use change.
The image on the left, Landsat MSS from 1975 shows an undeveloped
region. The image on the right, Landsat ETM+, shows the extent of
agricultural development by 2003. Since the mid-1980s, the resettlement of
people from the Altiplano (the Andean high plains) and a large agricultural
development effort (the Tierras Baja project) has lead to this area’s
deforestation. The rectangular, light coloured areas are fields of soybeans
cultivated for export, funded mostly by foreign loans. The dark strips running
through the fields are windbreaks, which are designed to protect the fine soil
from wind erosion
By overlaying additional data, such as, USDA Farm Service
Agency Field Boundaries and road information, even a 250
meter MODIS image can be used to aid in the delineation of
affected properties
250 meter MODIS image of Cass,County ND
Source: United Nations Environment Programme and USGS Center for Earth Resources
Observation and Science
Source: NASA and USDA Farm Service Agency
S
OCIETAL
B
ENEFIT
A
REAS
– A
GRICULTURE