


 136 / 287

[
] 137
The UK Climate Projections – Met Office
science and headline results
Vicky Pope, James Murphy, David Sexton, Geoff Jenkins, Daniel Williams, Julia Slingo, Met Office, United Kingdom
O
ur climate is changing faster than it has done for hundreds
of thousands of years, driven by the greenhouse gases
produced from human activities. Some changes have
already occurred and, because of the greenhouse gases already in
the atmosphere, we are guaranteed further changes in the coming
years and decades. This will have significant effects on the UK –
posing many potential threats and opportunities. It is essential to
understand these issues so that we can start adapting now for the
changes ahead.
The UK Climate Projections 2009 (UKCP09) – commissioned by
the UK Department of Environment, Food and Rural Affairs – are
a major step forward in addressing this need. UKCP09 involved the
Met Office Hadley Centre producing an ambitious and comprehensive
analysis of regional climate change. The projections provide proba-
bilistic information on how the UK’s climate will change in the 21st
century based on state of the art climate models, observations and
statistical analysis, combined with expert knowledge. The projections
are a key part of a programme of measures from the UK Government
to both encourage and support action to prepare for the impacts of
our changing climate. The UK Climate Impacts Programme (UKCIP)
provides the first point of contact to help stakeholders use UKCP09.
The projections are designed to inform planners and decision makers
about the risks associated with different levels of climate change in
their efforts to tackle future challenges.
How the projections were made
Scenarios of UK climate change were published in 1991,
1996, 1998 and 2002. These projections have formed
the basis for many climate adaptation schemes already in
progress. UKCP09 provides a step change in the informa-
tion available, by using the latest science and advanced
computing power to produce the most comprehensive
information to date.
The projections have been generated using the Met
Office Hadley Centre climate model – recognized as one
of the best in the world. This has been updated to take into
account improved understanding of the climate system –
such as recognition of how changes in the carbon cycle can
exacerbate climate change.
There are still inherent uncertainties in climatemodelling,
however. These focus around an incomplete understand-
ing of the complex processes of the atmosphere ocean and
land surface combinedwith natural varaibility. There is also
uncertainty as to how manmade greenhouse gas emissions
will change over the projection period.
UKCP09 tackles these uncertainties by using a range
of projections generated by running its model hundreds
of times using a range of different values for key param-
eters. This means many nuances in the understanding
of atmospheric science are taken into account. To
ensure an even wider spread of the possibilities is
considered, 12 of the world’s other leading models have
also been used to create projections. For the more local
projections (at 25 kilometres resolution), more detailed
climate models were run to include local factors that
are known to affect regional climate, such as mountains
and coastline.
The Met Office uses climate science, observations and
expert judgement to attach levels of confidence to each of
the projections. The level of probability given can be seen
as the relative degree to which each climate outcome is
supported by current evidence.
The probabilistic approach, used at a regional level for
the first time, allows UKCP09 users to get a clear picture of
the likelihood attached to each projection. This enables an
informed approach to risk–a highly important assessment
when making vital decisions on levels of adaptation.
The benefits of this approach are illustrated by compar-
ing results from UKCIP02 with those from UKCP09. The
UKCIP02 projections for changes in summer average
rainfall are shown to be very unlikely in the new UKCP09
O
bserving
, P
redicting
and
P
rojecting
C
limate
C
onditions
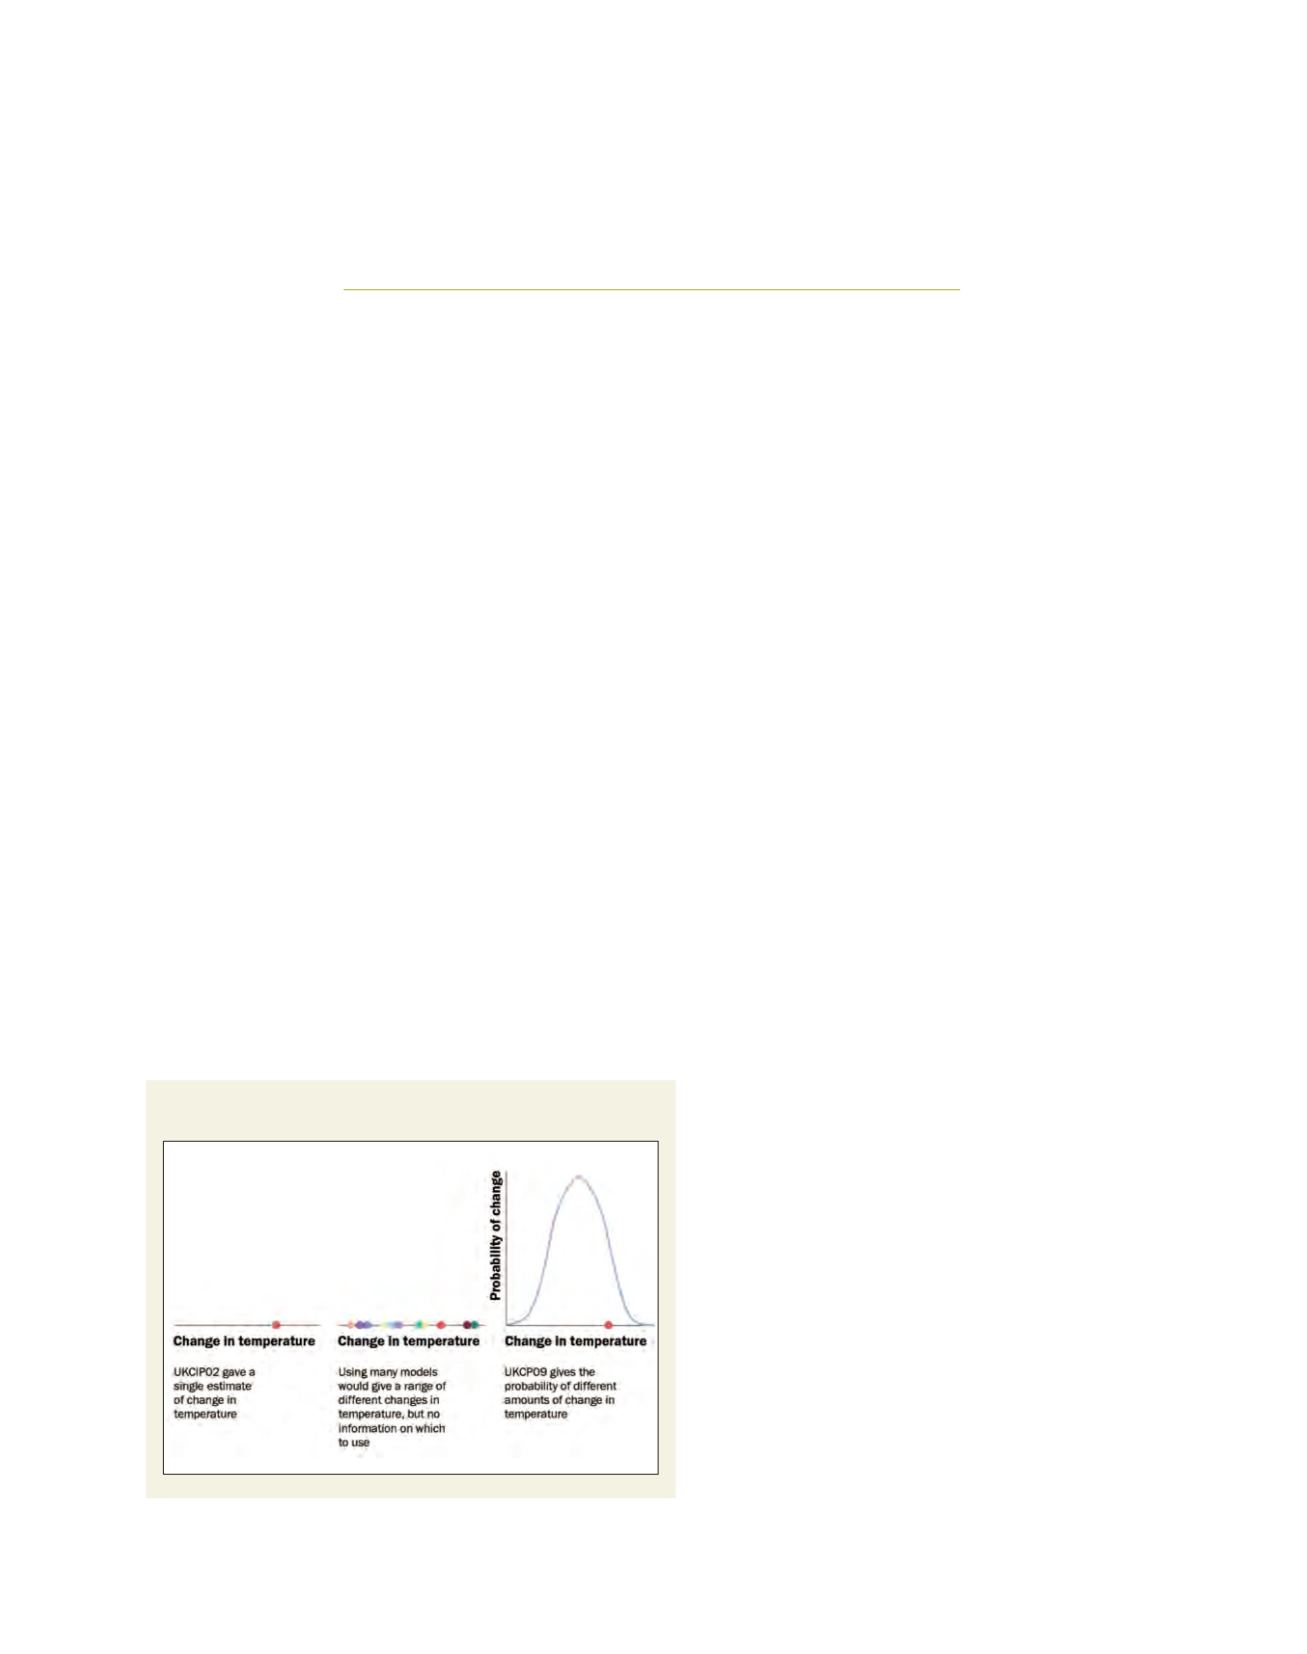
A schematic diagram showing the progression from UKCIP02 to
UKCP09, using temperature as an example
Source: Met Office UK