


 138 / 287

[
] 139
O
bserving
, P
redicting
and
P
rojecting
C
limate
C
onditions
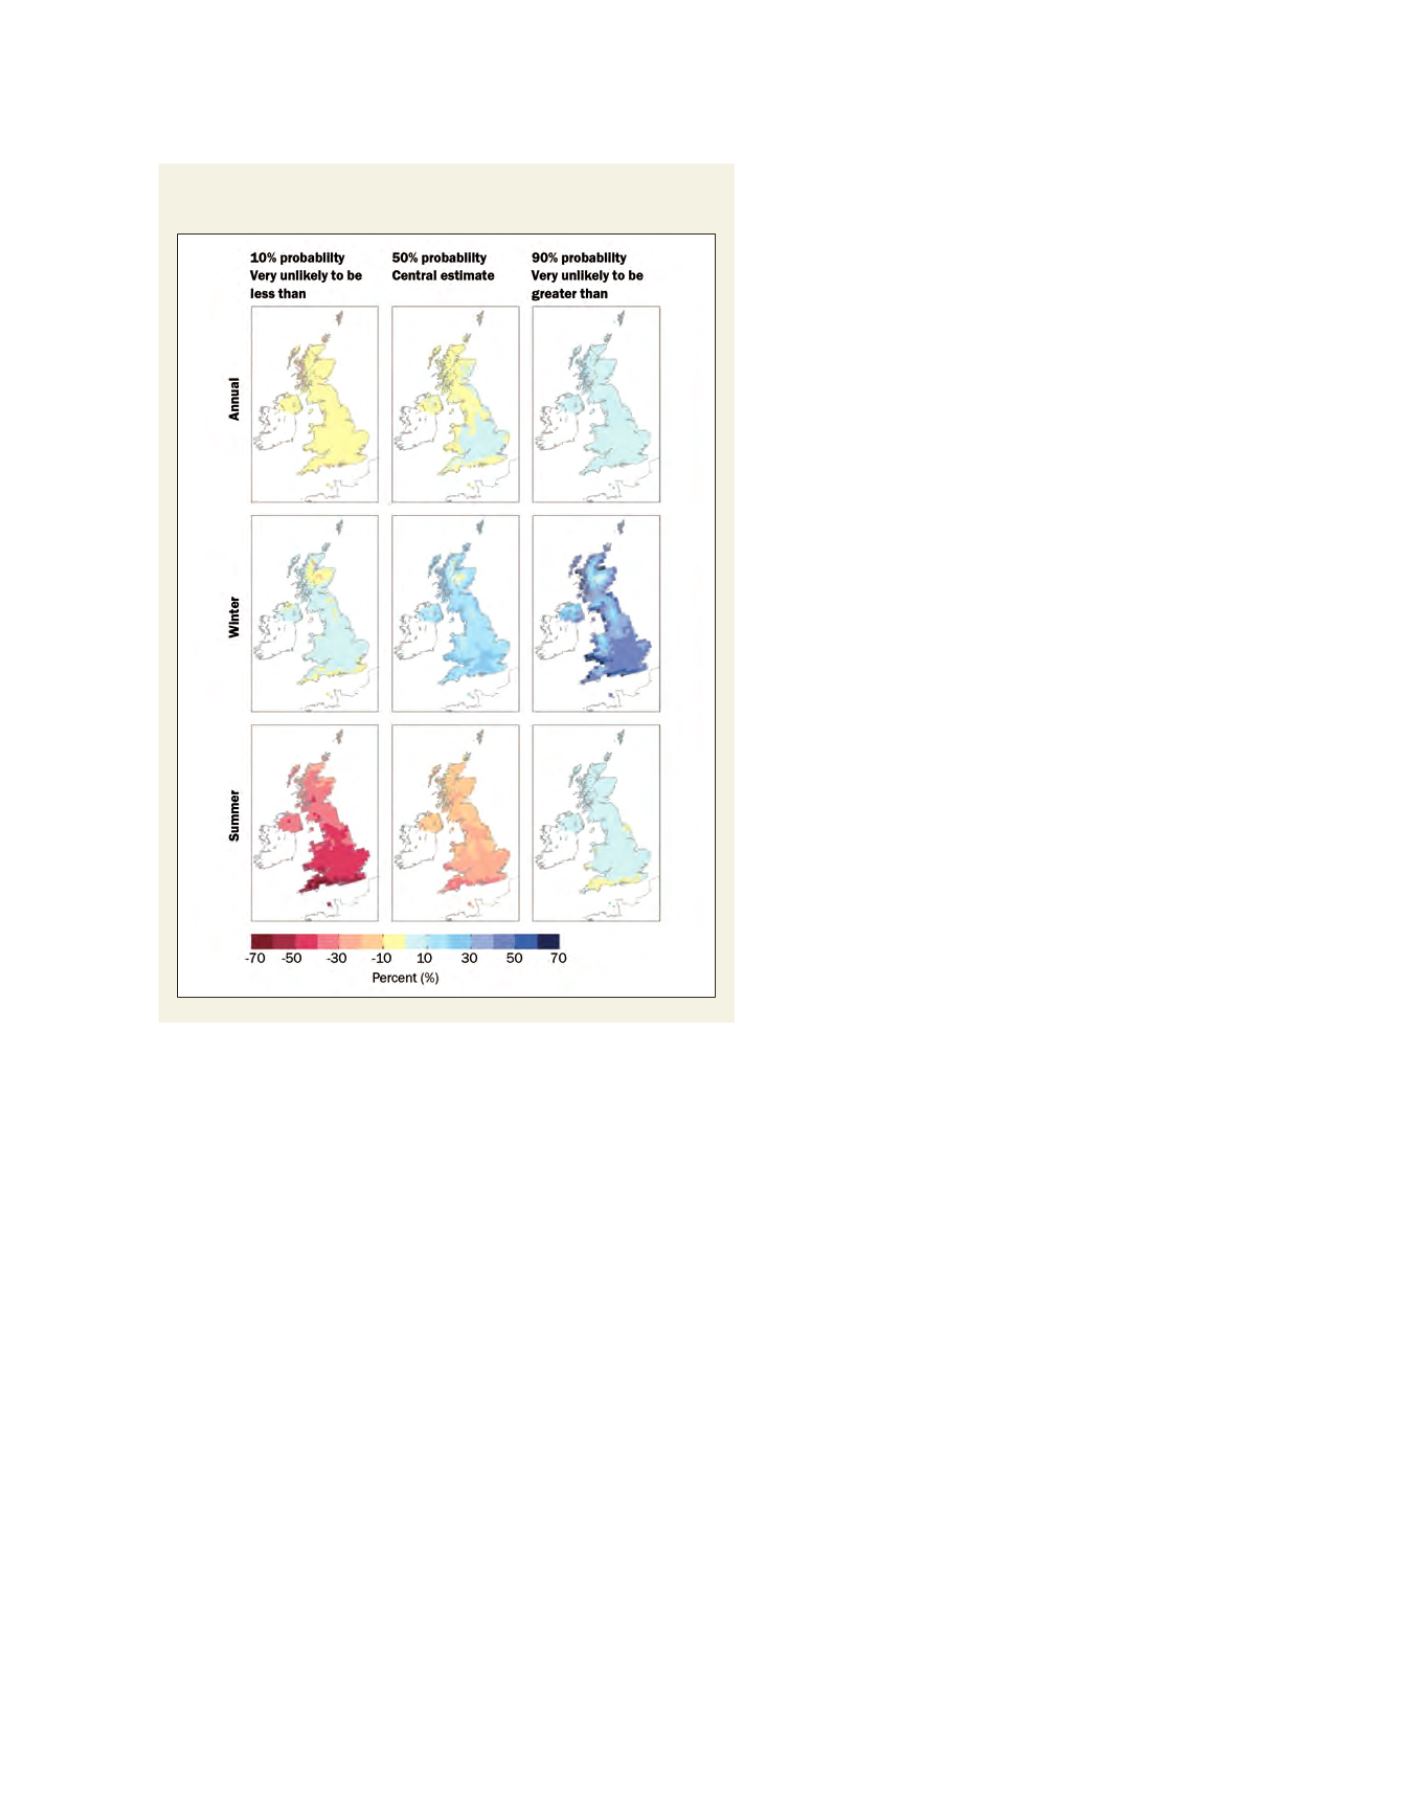
Maps of annual average winter and summer rainfall change
for the 2080s medium emissions compared with 1961-90
Source: Met Office UK
As a snapshot, the 50 per cent probability level (where the evidence for
being above or below this level is equally strong) gives a useful central
estimate. Looking at the spread of projections at different probabilities
will give a clearer picture, however.
Expected changes in climate
Temperatures will increase across theUK, more in summer than inwinter.
All areas will see increased winter rainfall and decreased summer rainfall,
with little overall change in the annual average (for the central estimate).
If the world economy and population continue to grow, but we move
away from fossil fuels to a more balanced energy mix and adopt new
energy saving technologies, this would constitute a medium emissions
scenario. Under such a scenario the summer average daily maximum
temperature rise in the south east of the UK by the 2080s is likely to be
above 2
o
C and below 6.4
o
C. The central estimate is 4
o
C. Hence, by the
2080s typical summers will be around 2
o
C warmer than the warmest
summers in the recent past (2003 and 2006).
The impacts on the warmest day of summer could be even more
dramatic. Although the central estimate of increases in the warmest day
is only 3
o
C the range is bigger than for average temperature. So there is a
10 per cent chance that increases could be as much as 10
o
C in some parts
of the UK. As such, the hottest day of summer could be 33
o
C, compared
with 30
o
C today. In a high emissions scenario, it is possible
that temperatures in London could reach a peak of 41
o
C.
The highest temperature recorded in the UK was 38.5 °C
on 10 August 2003 in Faversham, Kent.
If we look only 40 years ahead to the 2050s we can still
expect dramatic changes in climate, regardless of what we
do to decrease emissions in the interim. We are locked
in a climate trajectory for the next 30 years that reflects
our historic emissions. So under all scenarios, average
summer daily maximum temperatures will rise by around
2-3
o
C to 23.5-24.5
o
C, making a typical summer as hot as
the current warmest years on record. The 2003 and 2006
summer daily maximum temperatures were 23
o
C and
even the record-breaking summer of 1976 only reached
an average of 24.1
o
C.
With the same scenario for the 2080s, average summer
rainfall for the south east is unlikely to decrease by more
than 47 per cent, or increase by more than 7 per cent. The
central estimate is for a decrease of 22 per cent. In contrast,
during the winter, rainfall could increase significantly. In
the north west, for example, it is very unlikely to increase
by more than 35 per cent or by less than 3 per cent. The
central estimate is for rainfall to increase by 16 per cent.
It is, however, worth bearing in mind that there are large
natural variations in rainfall. As summer rainfall decreases,
on average we will see more dry records broken and fewer
wet ones, but variations will still be large.
Regional differences are predicted as small, except in
summer. Rainfall decreases more in the south andwest than
in the north and east. For example the central estimate of
summer rainfall ranges from decreases of 10-20 per cent in
Scotland to 30-40 per cent in Devon and Cornwall.
Rainfall changes in the 2050s is likely to be a bit smaller
with summer rainfall in the south east falling by 18 per cent
and winter rainfall in the north west increasing by 13 per
cent, or from349 to 396millimetres (where all these figures
are central estimates). Similarly the wettest day of the winter
will be wetter – on average increasing from 26 millimetres
today to 29 millimetres in 2050.
Adding value to the UK Climate Projections
UKCP09 represents a wealth of information that can add
real value to decisions on adaptation. However, the projec-
tions are complex and need to be carefully interpreted,
making full use of online documentation – such as the
user guidance available on the UKCP09 website. Additional
guidance can be provided by Defra fundedwork at UKCIP.
1
In addition, the Met Office can add value to UKCP09 by
generating information and solutions tailored to the
exact needs of users. This includes adding more detail to
projections by focusing on specific locations, variables or
scenarios, updating projections with the very latest science
or taking user-specific situations into account. For example
Extreme Value Analysis can be applied to UKCP09 to assess
how the severity and frequency of extreme weather may
change in the future. This information can be used when
planning future infrastructure – for example ensuring
adequate drainage on roads or future proofing public build-
ings to withstand increased hot spells.