


 137 / 287

[
] 138
O
bserving
, P
redicting
and
P
rOjecting
c
limate
c
OnditiOns
of the science. In most other fields the UKCIP02 results fall
close to the central estimate in the UKCP09 projections.
How the projections are delivered
Probabilistic projections are given at a resolution of 25
kilometres, but are also presented as averages over larger
land and marine regions. They are delivered over seven
overlapping 30-year periods and for three future emissions
scenarios. Variables covered include temperature, precipi-
tation, relative humidity, cloud cover, heat radiation and
mean sea level pressure. Monthly, seasonal and annual aver-
aged data are also provided.
There is a range of confidence within the climate projec-
tions. There is very high confidence in global warming
due to manmade greenhouse gas emissions, while only
moderate confidence in projections at a continental scale.
Information at a resolution of 25 kilometres is based on the
continental scale, but includes the influence of local condi-
tions such as mountains and coastline. However, adding
regional detail also adds uncertainty. Confidence is also
affected by the variable under discussion. For example, no
probability information is given for regional or local wind
changes.
What the projections tell us
The projections give a measure of the strength of evidence
for theUKclimate changing in a particularway–a projected
level of precipitation or temperature rise, for instance. The
probability depends on the weight of scientific evidence
behind the projections. It’s important to understand these
probabilities reflect how sure we are that a change will
happen, rather than the ‘percentage chance’ of it occurring.
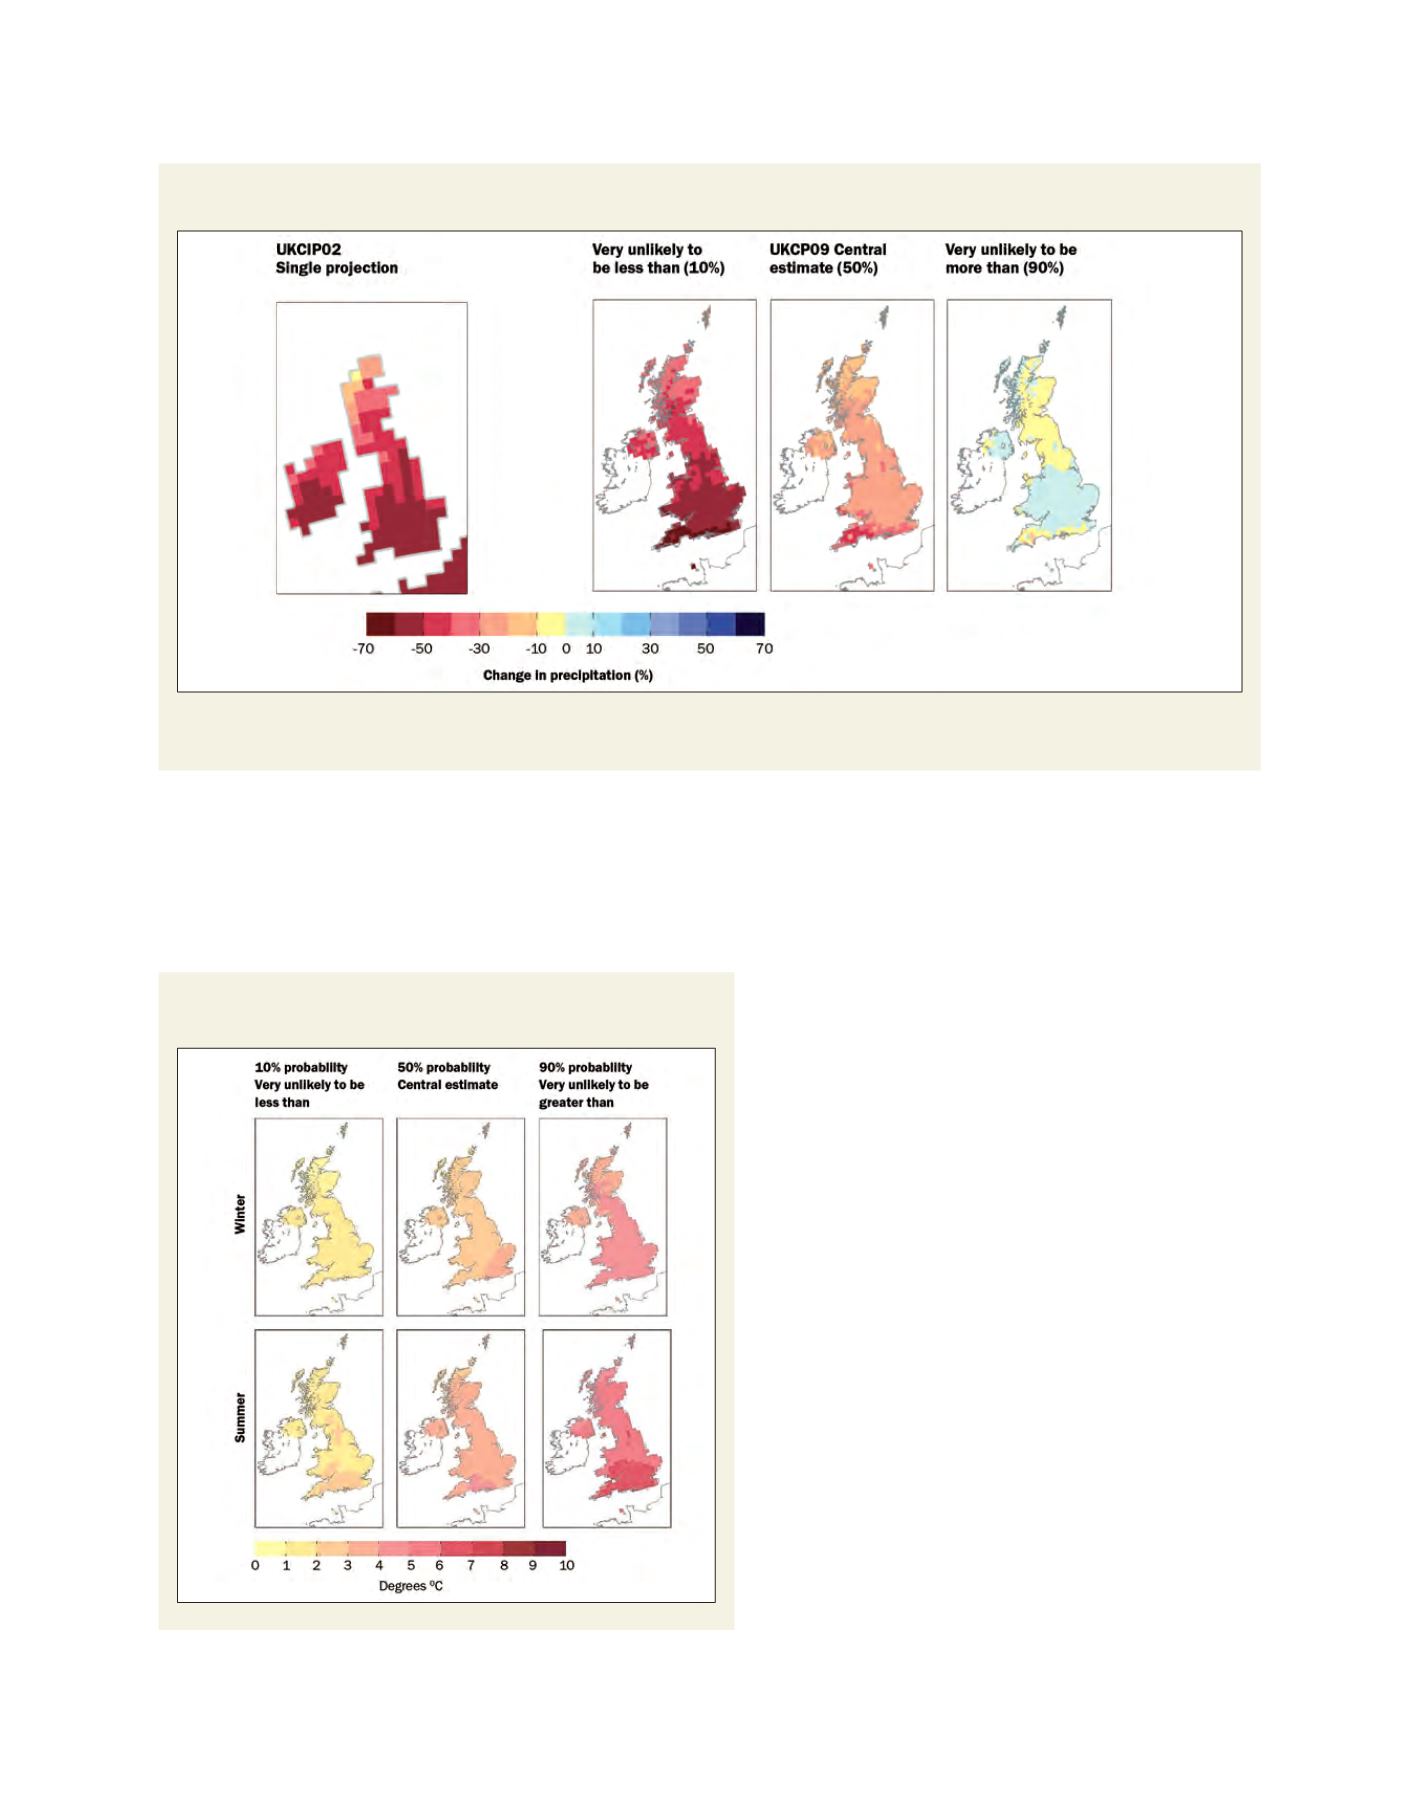
projections. UKCIP02 overestimated the reductions in rainfall because its
model (HadCM3) has a tendency to dry out compared to other models.
The new projections better encompass the true range of our knowledge
Comparison of changes in summer average rainfall by the 2080s under high emissions scenarios,
from the UKCIP02 report and as projected in UKCP09
Source: Met Office UK
Maps of winter and summer temperature change for
2080s medium emissions compared with 1961-90
Source: Met Office UK
The 50 per cent probability level (where the evidence for being above or below this level is equally strong) gives a useful central estimate. The 10 per cent and
90 per cent probability levels give a useful range of possible outcomes