


 27 / 156

have historically been subject to adverse weather conditions and,
in a statistical sense, are more likely to face similar problems in
the future. Vulnerability analysis mapping, on the other hand,
commonly used since the late 1980s, combines the probability of
exposure to adverse conditions in a certain area with some
measure of ‘coping capacity’ by people living in that area. Simply
put, coping capacity refers to a population’s ability to manage a
crisis, either in the short or longer term. It depends on such
factors as level of savings and liquid assets, diversification of
production and other economic activities, mobility, and access
to alternative employment, usually through seasonal migration.
For a given area, exposure to risk for a point in time can be
expressed as the current relative level of risk compared to its
historical average – for a drought-prone area, one might use the
standardized precipitation index (SPI) for example.
5
Measures of
coping capacity are, on the other hand, usually expressed in qual-
itative terms, by type of livelihood system. A ‘typical’ household
in a traditional transhumant pastoral system, for example, is
assumed to have certain attributes with respect to income diver-
sification, access to alternative earning opportunities, etc.
Obviously, once one has established, for a given area, the relative
level of vulnerability compared to others (and, therefore, mapped
this area as having ‘high’, ‘medium’ or ‘low’ vulnerability), one still
has to account for changes over time in the variables determining
exposure to risk and extent of coping capacity. National food secu-
rity monitoring and early warning systems in many countries do a
good job of mapping long-term, or structural, vulnerability. When
historical patterns repeat themselves, they provide a good guide of
where vulnerability to food insecurity is being heightened by a disas-
ter. However, adverse weather can be atypical, and the variables
underlying coping capacity, such as the terms of trade between
cereals and small ruminants, for instance, or food prices and
seasonal labour opportunities in neighbouring countries, can change
in unexpected ways or faster than anticipated.
Unless monitoring systems can capture and integrate this kind
of information in a timely fashion at the national level, there can
be significant differences between ‘vulnerability maps’ and the
actual geographical distribution of the consequences of food inse-
curity, as measured by malnutrition rates, for example. During
the recent Niger crisis of 2004-2005, long-term vulnerability maps
provided a good guide to some areas where food insecurity was
indeed acute, but they missed significant southern areas with
higher rainfall. In such areas, very high population density and
drastic changes in land tenure reduced the households’ capacity
[
] 27
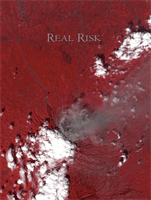
2001-2004
1996-2000
1991-1995
1986-1990
5
10
15
20
25
30
Africa
Asia-Pacific
Europe
Latin America
Near East
Average number of food emergencies
to produce their own food; faced with the record high prices of
2004-2005, they became even more food insecure than popula-
tions living in more marginal parts of the country, but where
extensive cultivation can still provide a partial hedge against risk.
Overall, population in a given area is considered vulnerable if
long-term exposure to risk (such as drought) is higher than long-
term coping capacity. In the short-term, however, risk exposure
and coping capacity can significantly depart from historical
average levels. Timely monitoring and analysis of the determi-
nants of risk and coping capacity, by main ecological or livelihood
system, allow for a ‘redrawing’ of relative vulnerability maps upon
which one can base localized surveys or even emergency relief
interventions. This type of dynamic risk mapping requires a good
understanding of the determinants of risk and of coping capac-
ity by livelihood system, combined with rapid information
gathering and analysis capability. This remains a challenge for
many countries, but technological advances in weather monitor-
ing, satellite data acquisition and processing, and data collection,
communication and analysis are easing the task, efficiently and
at relatively low cost.
With support from the European Commission, FAO has devel-
oped an analytical tool for vulnerability analysis and early warning
– the GIEWS Workstation allows the analyst to combine on one
electronic desktop country maps and geographical features, satel-
lite imagery including vegetation index and rainfall estimates, and
geographically referenced data such as land use and crop distri-
bution, population and price statistics, etc.
The GIEWS workstation is now being introduced for use at the
national level. In Ethiopia, FAO, in collaboration with the World
Food Programme, is providing the workstation to the Central
Statistical Authority and to the Ministry of Agriculture. The tool is
to be used in connection with ground surveys designed to calibrate
and validate medium or high resolution satellite imagery to derive
much more precise estimates of area cultivated and agricultural
production, timing of planting and yields. It will also integrate basic
food and livestock prices, as well as district-level information on
incomes and other household parameters. Since the workstation is
designed to allow for synchronization of data between separate
units (ten will be installed in the country), information exchange
will be faster and more accurate. With the help of such a tool, coun-
tries like Ethiopia will be able to specify not only which areas are
traditionally more vulnerable, but also, and in real time, how the
weather and economic conditions of each growing season modify
the risk landscape of the main ecological zones of the country.
6
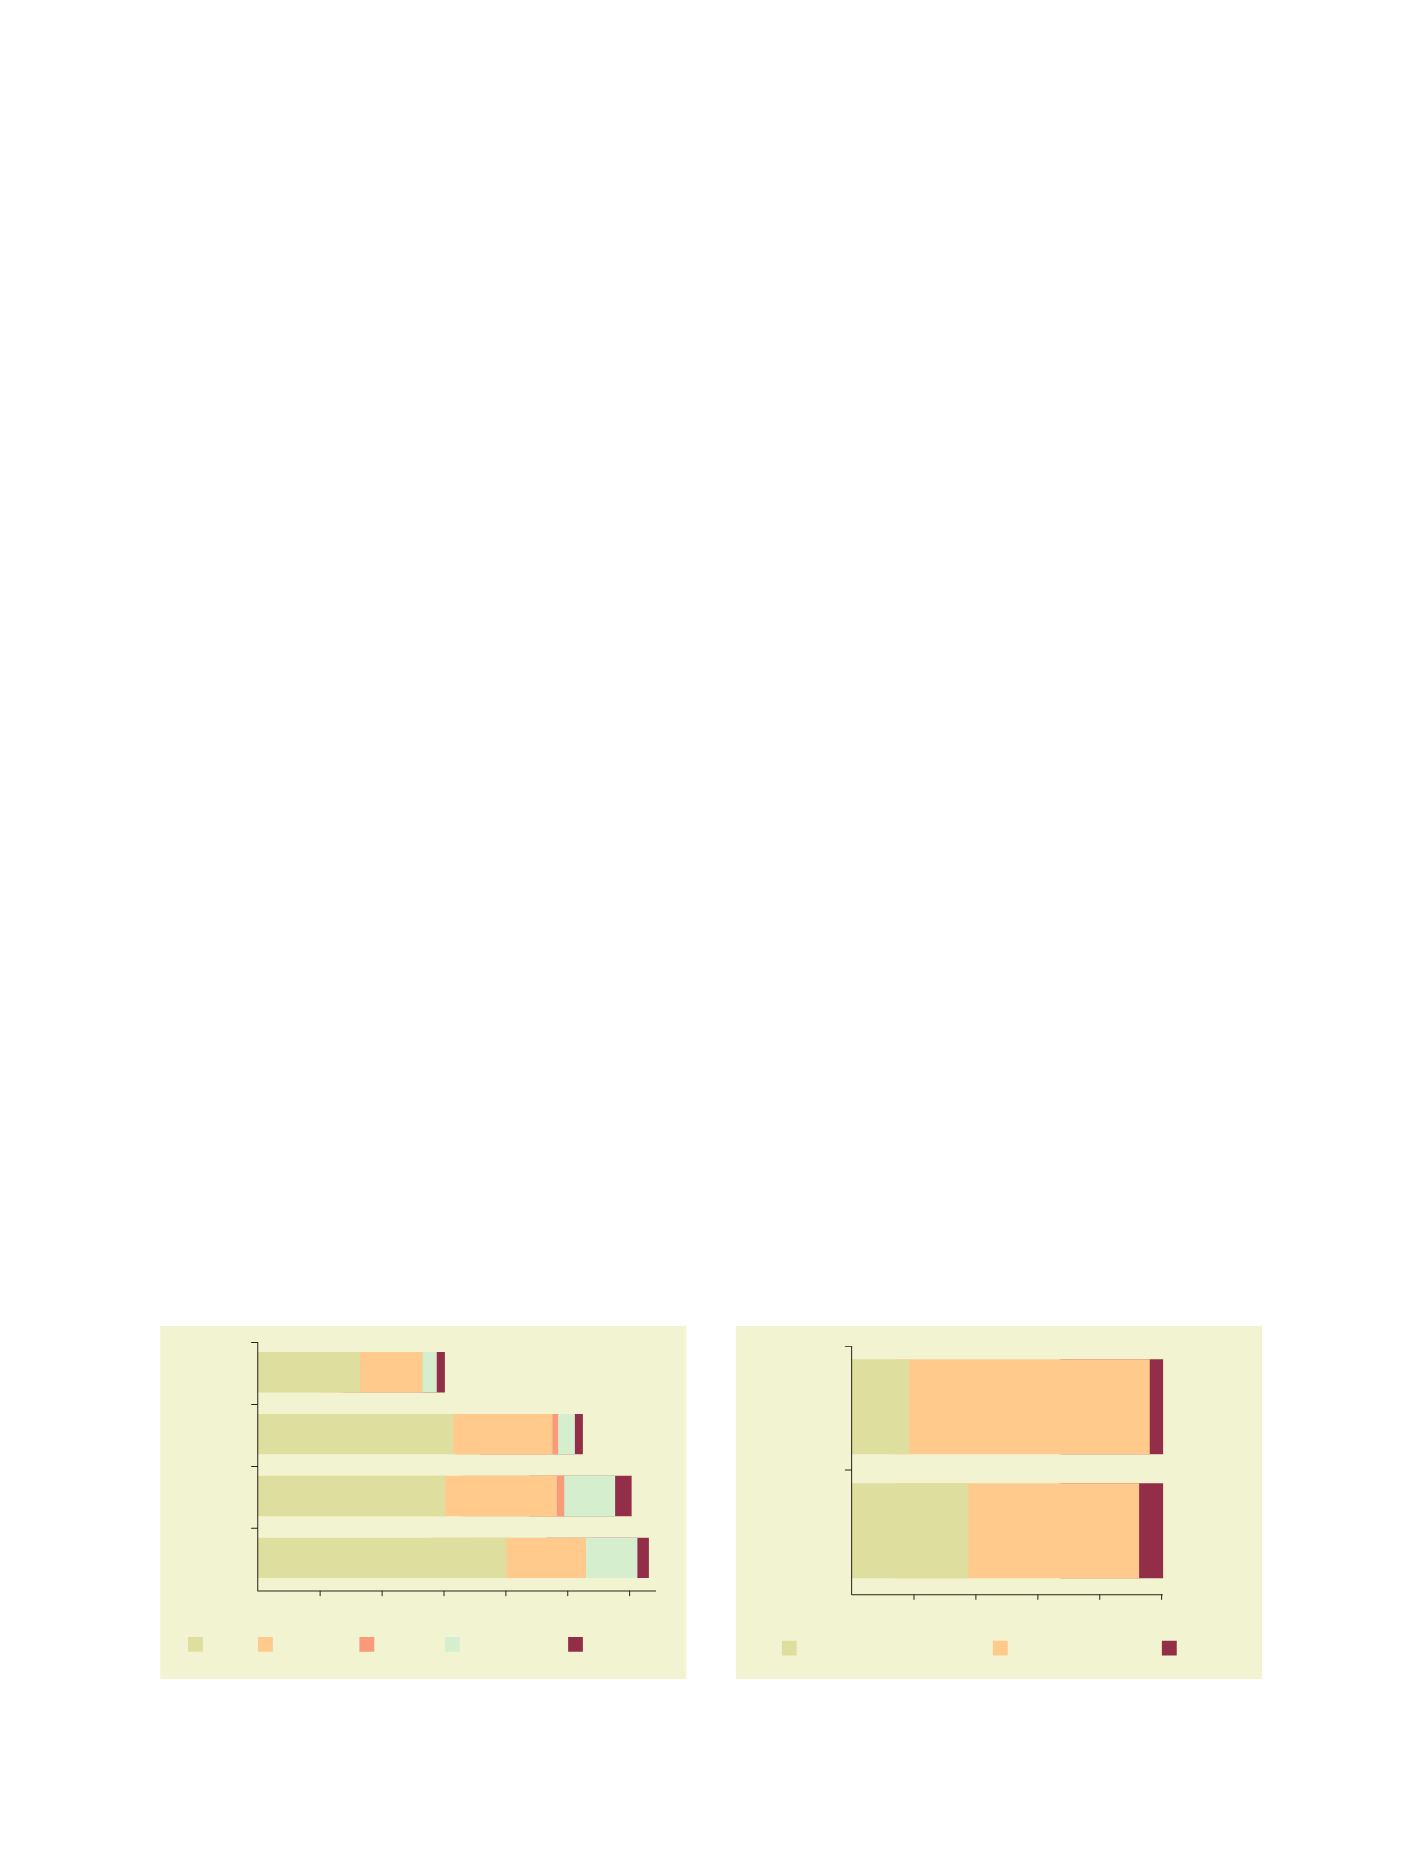
1992-2004
1986-1991
20
40
65
80
100
Human-induced (mainly conflict)
Natural (mainly drought)
Mixed
% of crises for which primary cause was
Source: FAO
Food emergencies by region
Source: FAO
Primary causes of food crises