


 32 / 156

Hurricane activity in the North Atlantic and climatic setting
Recent scientific findings in climate research confirm that the trop-
ical cyclone hazard in the North Atlantic has increased markedly
since the mid-1990s. Cyclones there have become more intense and
have been reaching very high wind speeds for longer periods of time.
This increase in intensity is associated with a global increase in sea
surface temperatures, averaging approximately 0.5°C (0.9°F) during
the summer season in all tropical ocean regions since 1970. A
comparison of the recorded trend and computer simulations reveals
that this warming can only be the result of anthropogenic climate
change. Globally, the annual number of strong tropical cyclones (cate-
gories 4 and 5 on the Saffir-Simpson Scale) has more than doubled,
from around eight in the early 1970s to 18 in recent years.
In the North Atlantic, it is not only the intensity that is increas-
ing but also the frequency. The primary factor for this is –
according to scientific studies – the natural cycle of sea surface
temperatures (Atlantic multidecadal oscillation or AMO). The
record number of cyclones in the 2005 season coincides with what
current data indicates to be the highest mean annual temperature
measured in the North Atlantic since records began around 1870.
This is most likely due to the simultaneous influence of two
processes that determine sea temperature and hurricane activity:
natural climate oscillation in the Atlantic, and the long-term
warming process caused by anthropogenic climate change.
Building vulnerability
Catastrophe events of recent years have provided the insurance indus-
try with a vast amount of claims data that has also enabled
conclusions to be drawn regarding the effectiveness of mitigation
measures discussed in the aftermath of major historic disasters.
Some key observations were made in the wake of the US hurri-
canes of 2004 and 2005. As seen in the Florida hurricanes of 2004,
newer residential constructions typically fared much better during
Hurricane Katrina than older buildings, due to the relative newness
of their structural components.
However, new buildings in Louisiana and Mississippi did not
perform as well as in Florida, because neither Louisiana or Mississippi
had statewide residential building codes enacted at the time of the
storm. Both states left the adoption and enforcement of building
codes up to local municipalities, and only a few opted to take such
measures. When compared with Florida, which has strict wind design
codes, differences in new buildings’ performance were apparent.
Mitigation measures that are effective in preventing wind damage
to buildings, such as hurricane shutters and seawalls, are practically
nonexistent along the Gulf Coast outside of Florida, except in some
affluent residential neighbourhoods. To protect a building against
wind damage, it is extremely important to keep its envelope intact.
Window shutters are very effective because they resist wind pres-
sure better than glass and they can protect windows from being
shattered by flying debris. This lack of shutters and other protection
measures is likely to have led to increased property damage due to
blown-in windows and subsequent wind and water damage.
Consequences for the insurance industry:
new loss distributions
The loss statistics from natural catastrophes clearly indicate a long-
term trend toward higher costs. Besides socio-economic reasons,
changing weather patterns and only limited mitigation measures are
the key drivers responsible for this adverse development. What is to
be done from a risk-taker’s perspective?
The insurance industry must adjust the assumptions at the very
basis of its definition of hazard (windstorm, flooding) where scien-
tific data and studies provide strong indications that this is
necessary. Science has made considerable progress in this area,
particularly in 2005. For instance, today we know that the descrip-
tion of a hurricane hazard as the average of a time series of over
100 years cannot serve as the basis for adequate risk management.
This discussion has focused on changing hurricane frequen-
cies and vulnerabilities in the US due to the outstanding hurricane
catastrophes of 2004 and 2005 in the context of long-term loss
trends. However, Munich Re is continuing its analyses of natural
climate cycles and the effects of climate change with regard to
hazards in other regions too, such as tropical cyclones in the
Pacific and Indian Ocean and winter storms in Europe. This will
enable us to anticipate future changes in risks and incorporate
them in risk models.
[
] 32
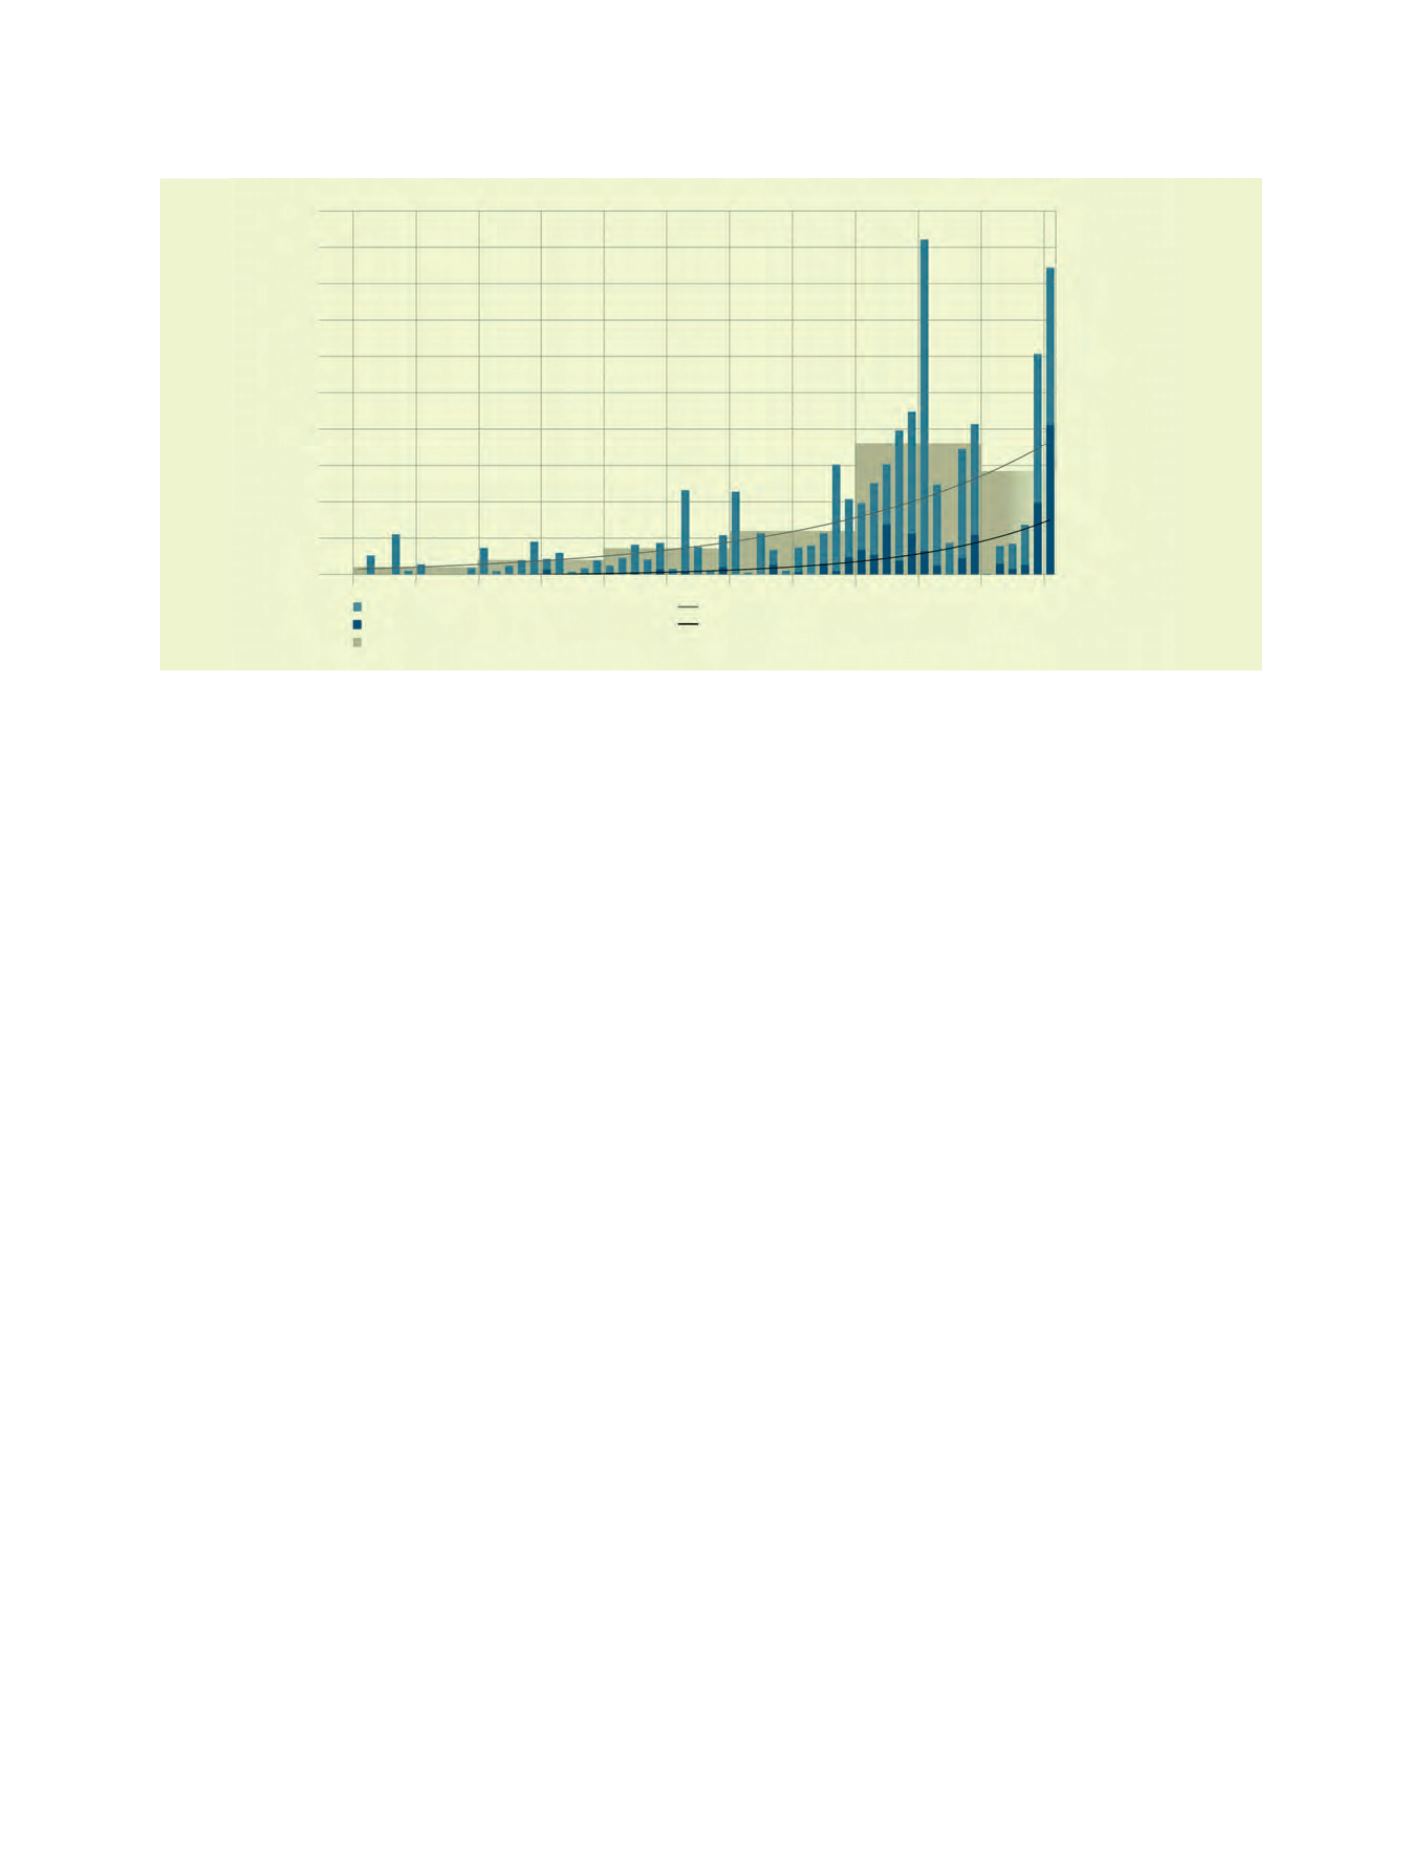
1950
1955
1960
1965
1970
1975
1980
1985
1990
1995 2000
2005
Trend: Insured losses
Trend: Overall losses
Of which insured losses losses (2005 values)
Overall losses (2005 values)
Decade averages of overall losses
0
20
40
60
80
100
120
140
160
180
USD bn
Source: NatCat
SERVICE
, Munich Re
Great natural catastrophes 1950-2005, Overall losses and insured losses – Absolute values and long-term trends