


 151 / 196

[
] 149
CDCP. There were four separate TBTI sessions that began in January
2008 and culminated with a peer review panel in June 2008.
The TBTI training session focused on identifying aspects and func-
tionalities of the network that were critical to enhancing information
sharing, communications, and desired features that the network
should convey. There were both technical-scientific and data manage-
ment design function issues that had to be resolved, along with
development of a common data and minimal notification/alert input.
In addition, procedures to be followed by the ESN in issuing notifi-
cation and alerts were developed.
Participants believed it was important to keep the common data
input simple and complementary to procedures already used by
each respective member of the ESN, so as to avoid duplication and
complexity. What emerged was a straight-forward consensus-
driven agreement and process consisting of three primary
elements.
First, that each single event is reported into the ESN and each ESN
member is notified. Second, if two incidents occur within 24 hours
and within a 10-mile radius, the two reporting parties are notified,
confer and report back to the network on the relatedness and signif-
icance of the two events. This may range from two completely
unrelated events (low level concern) to two events that have co-
occurred and appear to be related (most severe), which result in an
additional notification that indicates whether further action by the
network is warranted. Finally, if three or more events occur within
a 24-hour period, the entire network is notified to confer and after
conferencing, a determination will be made as to the relatedness,
severity, and cause of each event. Unrelated events with multiple
insignificant causes not related to perceived DHS threats, would no
longer be considered and the ESN would return to its normal moni-
toring state. If the three events are found to be related, significant
and possibly related to a perceived DHS threat, a decision to notify
and alert the SC Emergency Preparedness Office (SCEPO) would
occur using REACH (SC Emergency Notification System including
reverse 911 capabilities) which would then convene SCEPO and the
ESN Team as needed.
Following this notification by REACH, SCEPO would
then decide what additional assets are needed, as well
as the steps that need to be taken to notify, alert, and/or
evacuate the public. In addition law enforcement, mili-
tary and other appropriate assets would be alerted.
The ESN data management system, hosted by NOAA’s
Coastal Data Development Center (NCDDC), comprises
components for data entry, web mapping display, and
constituent notification. Data may be entered manually
through a web form or may be harvested automatically
(every two hours) through web service access into
networks member databases. This approach was used
for several reasons, as it allows flexibility among
members in alerting the network, given competing work
demands within each agency. It also permits an agency
to provide alerts without access to restricted data, such
as some of the farm animal databases used by the SC
Veterinarian’s Office in conjunction with the US
Department of Agriculture. This flexibility encourages
reporting and assures multiple alerts occur in a timely
manner.
The types of alerts the system reports are primarily of
mortality, disease, or adverse environmental quality. This
may include fish kills, marine mammal strandings,
harmful algal blooms (HABs), companion and domestic
animal mortalities, bird kills, wildlife mortality, water
quality factors (such as dissolved oxygen, pH, and
temperature conditions) and water quantity alterations
such as stream gauge data on flows for drought and flood
conditions.
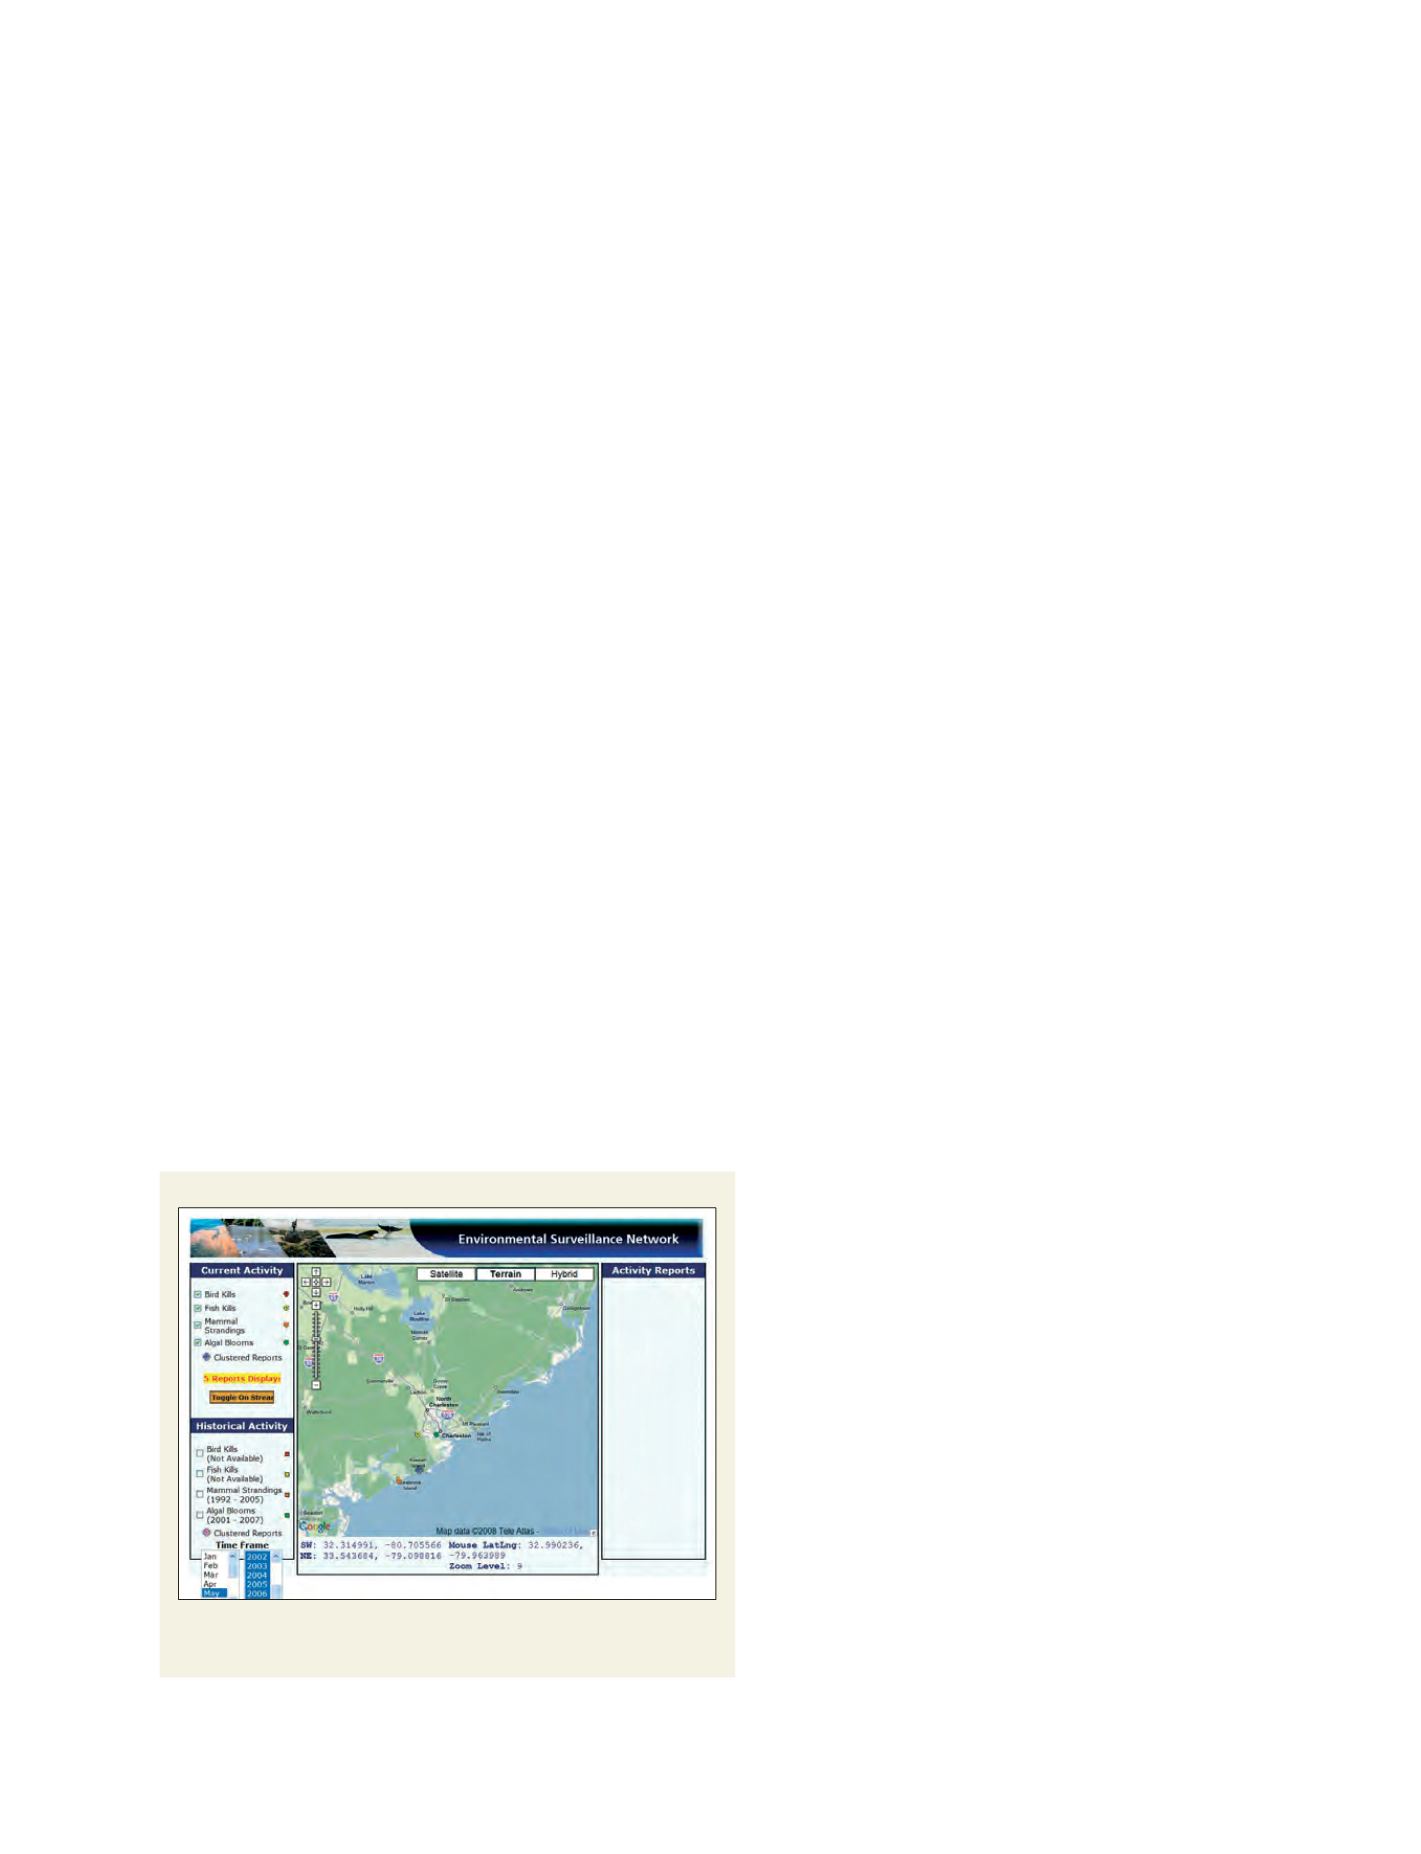
The system allows for visualization of reported infor-
mation to the ESN using a Google Map format. This in
turn allows data overlays of multiple information such as
fish kills, marine mammal strandings and HAB events,
which if clicked upon provides more detailed information
about each event such as the species involved, size of the
event and contact information. It also catalogues histori-
cal data for each ESN data entry and permits both
historical and real time data to be visualized and displayed.
Historical data are very important, since the system
analyst’s first question will be: “Has this ever happened
before?” And, if so: “At what location?” This provides
great insight into better defining the degree of unique-
ness and unusual nature an individually reported ESN
event may have. This will not only enhance communi-
cation among ESN members but will also provide the
proper historical context to assess each event or multi-
ple events.
Outcomes and accomplishments
The following outcomes and accomplishments have
been achieved to date in regard to the ESN:
• Agreement that knowledge of real-time natural
resource mortalities is important to the alert and
warning processes
• Participant commitment
• Notification process is simple without much
development effort
– Visual reporting that is location driven
Source: NOAA NCCOS/CCEHBR and NESDIS/NCDDC
Web mapping
Map display of the Environmental Surveillance Network, depicting the location of
near real-time fish kills, marine mammal strandings and harmful algal blooms