


 123 / 287

[
] 124
O
bserving
, P
redicting
and
P
rOjecting
c
limate
c
OnditiOns
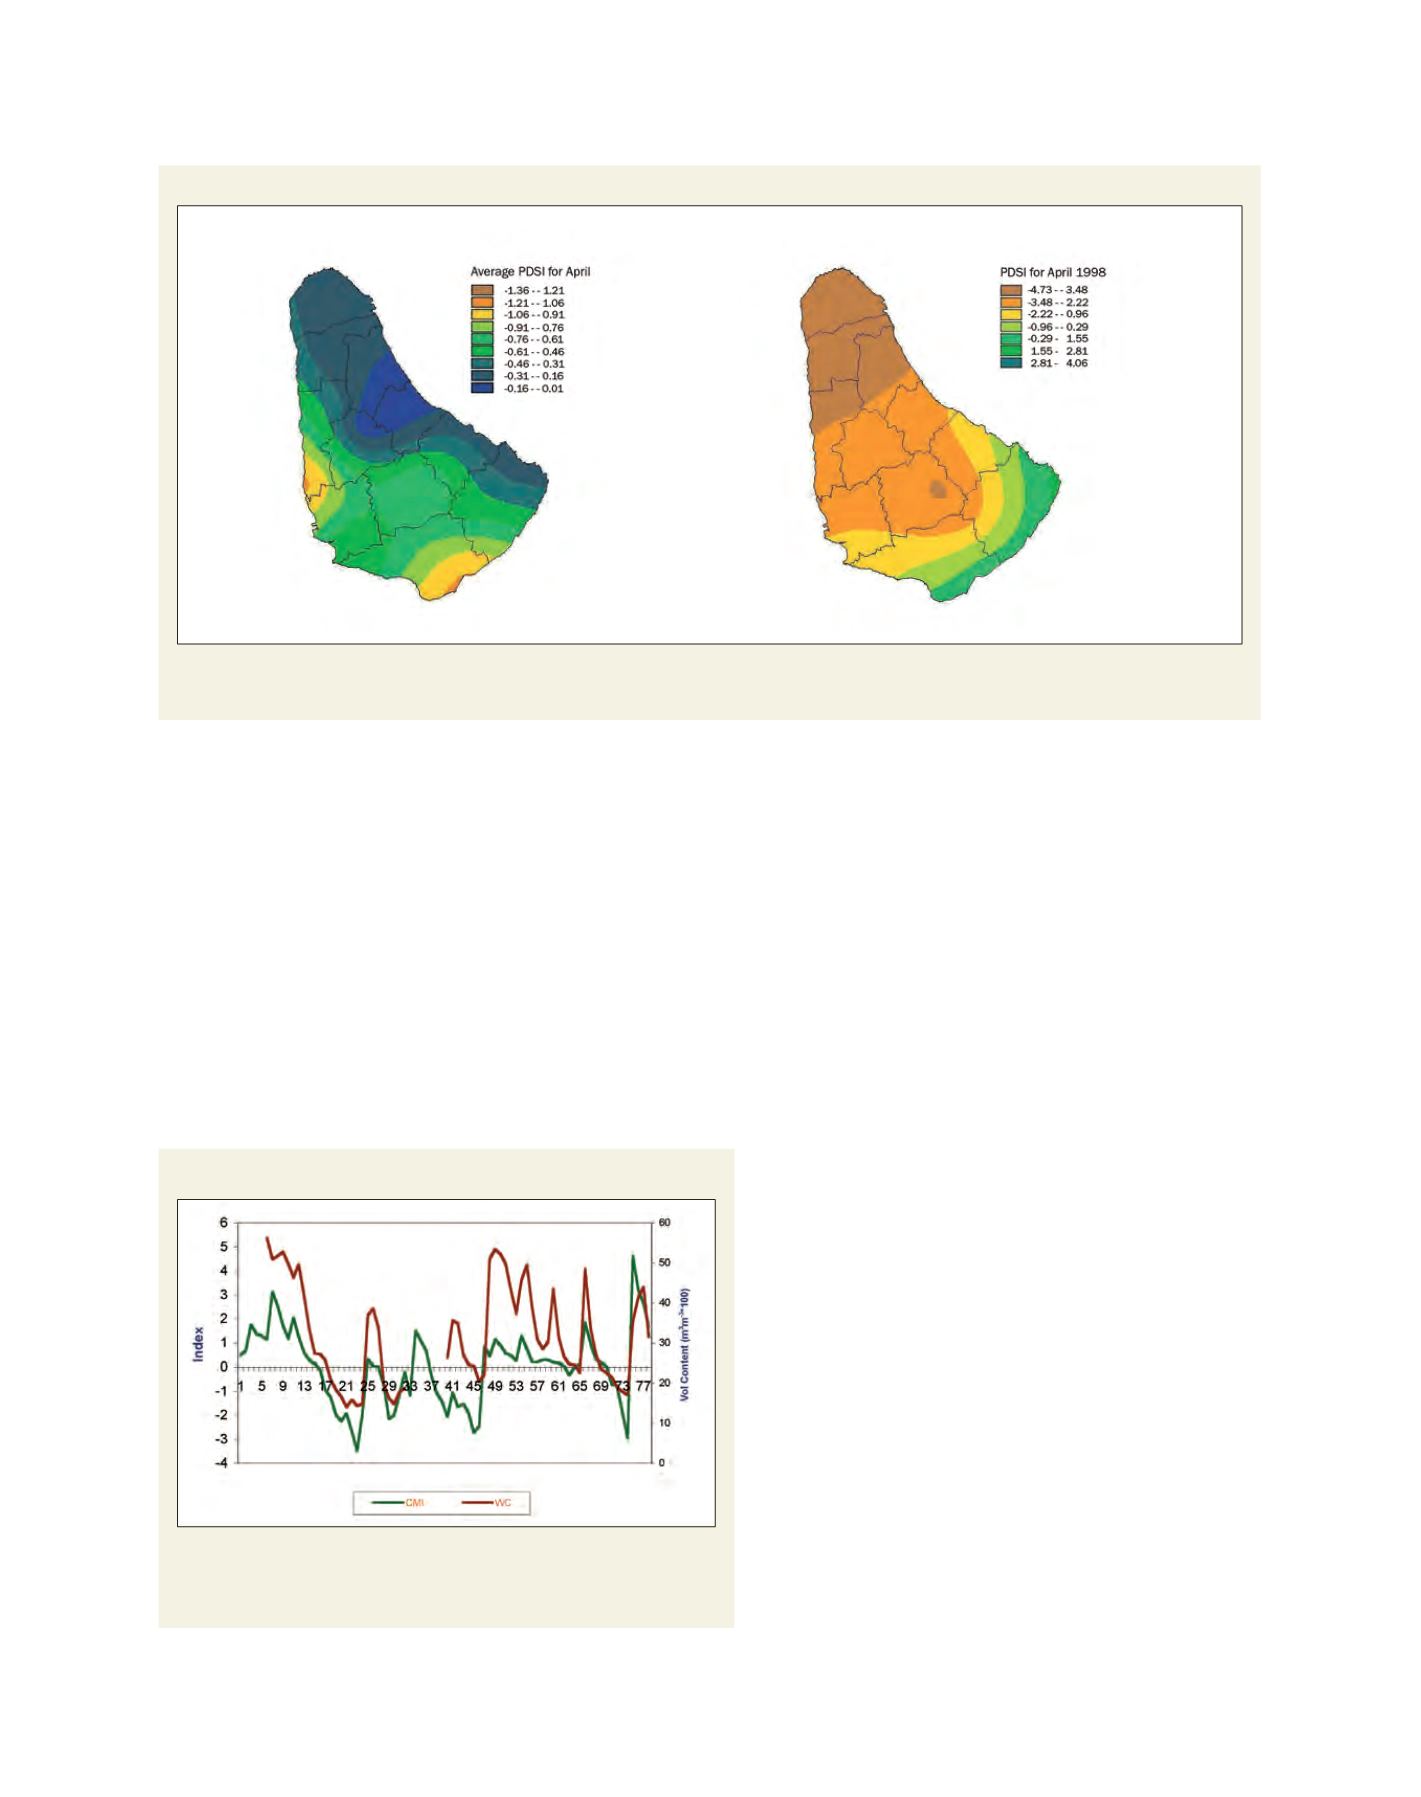
Crop Moisture Index (CMI) and measured soil moisture
Time series of CMI, and measured soil water content (using Sutron’s 5600-
0089 Soil Moisture/Temperature Sensor) at 10 cm depth at CIMH. The
correlation between CMI and measured soil moisture was 0.74
Source: Shontelle Stoute
also includes some islands forming an archipelago, as well as
coastal South and Central America. The only indices/indicators
of drought that would merit use on the regional scale would
therefore have to be related to rainfall – as water flows, water
levels and soil moisture would not apply. SPI maps are currently
produced, with the intention of adding deciles to the monitoring.
The first regional maps were produced on 7 April 2009, which
provided the precipitation status as of the end of March on four
timescales, reflecting the reality that different types of drought
manifest themselves after different times lengths of exposure (for
example, agricultural drought is expressed much sooner than
hydrological drought).
As many land stations as possible are being sought
for the production of these maps. Over the sea and in
areas where land data is not currently provided, NCEP/
NCAR
23
reanalysis data is used. Currently 14 coun-
tries, particularly in the Eastern Caribbean, contribute
monthly data to this endeavour. With time more coun-
tries in the archipelago are anticipated to contribute
data, restricting the use of reanalysis data to over the
sea. It is also important that there is some investigation
into the relationship between the reanalysis data and
actual station data. This task will also be performed.
Using the reanalysis and land station data, SPI maps for
1, 3, 6 and 12 month intervals are being produced in
under seven days after the end of each month.
National monitoring
National monitoring will occur in the three
CARIWIN partner countries of Jamaica, Guyana and
Grenada. Another collaboration between CIMH and
The Institute of Earth Sciences, University of Applied
Sciences of Southern Switzerland would allow for
two other islands (Barbados and Trinidad) to be
included in the monitoring. It has to be determined
which indices and indicators will be used to monitor
drought in these countries. Unlike Caribbean Basin
monitoring, indices and indicators utilizing data
other than precipitation can also be engaged. Possible
data sets that can be made available are currently
being investigated; for example soil moisture, soil
available water capacity, evapotranspiration, vegeta-
tion indicators, streamflow and reservoir levels. The
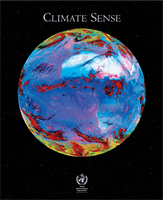
usefulness of PDSI and CMI has already been inves-
tigated in Barbados in a preliminary way. In Jamaica,
investigations are taking place into the use of the Soil
Mean PDSI maps for Barbados
Mean PDSI map for April (left), and PDSI for April 1998 (right), an El Niño year, which was also drier than normal in Barbados.
Note the more negative (drier) values in April 1998
Source: Shontelle Stoute