


 183 / 218

[
] 181
Beginning in 2000 and continuing through 2004, the
researchers organized and facilitated annual forecast work-
shops in four representative farming communities. Working
with the local agricultural extension service and other commu-
nity leaders, they invited a representative sample of roughly
50 farmers to each workshop. Farmers presented their inter-
pretation of the previous season’s events: what had been
forecast; how the rains had actually fallen; and which crop vari-
eties had produced the best results. They then presented their
own local indicators for the coming growing season. Next, the
researchers presented the probabilistic forecast, which had been
issued only days before at the SARCOF and downscaled by the
Zimbabwe NMHS. They answered farmers’ questions about the
forecast, including the role of ENSO and other global drivers,
and a comparison of the forecast with the local indicators. With
consideration of local historical rainfall records, they discussed
what the probabilistic forecast implied in terms of actual rain-
fall quantities. Representatives from the agricultural extension
service then discussed with farmers specific actions – the selec-
tion of crop varieties and planting dates – that could be taken
in response to the forecast and other economic considerations.
The workshops ended with a meal, where other community
issues were discussed.
To reach robust conclusions about the value of the forecast,
the researchers administered a household survey at the conclu-
sion of the growing season, asking farmers about the planting
decisions they had made, and their estimated yields for each
crop variety from that season and prior seasons. Over two years
of the survey (2003 and 2004) enumerators obtained valid data
for 495 households, a random sample within each community
including both those who had and had not participated in the
pre-season workshop.
Results of the study
The study generated both qualitative and quantitative results,
which were published in the 30 August 2005 issue of
Proceedings of the National Academy of Sciences
. At the work-
shops, farmers expressed enthusiasm for receiving the forecast,
and participated actively in discussion of ENSO and other rain-
fall determinants. They expressed greater confidence in the
forecast after they had been able to ask questions about it, and
said that this opportunity also increased their appreciation of
the forecast they heard over the radio, realizing that it was
fundamentally the same forecast. Data from the survey was
used to provide one of the first robust estimates of the fore-
casts’ added value, and the added value of a participatory
communication approach.
To examine forecast value, the researchers compared farmers’
yield estimates with their estimated historical yields to generate
a relative harvest indicator. The indicator corrected for individ-
ual farmers’ estimation error and took into account diverse
growing conditions. The first year of the survey, 2003, had been
an El Niño year with normal, to below normal forecasted rains.
The actual rains had been below normal. The relative harvest
indicator showed that most farmers had received close to their
lowest historical yields. In this year, farmers who reported using
the forecast to make different decisions outperformed those who
did not use the forecast by an average of 3.6 per cent, although
the difference between the two groups was not statistically signif-
icant. The second year, 2004, had neutral ENSO conditions, and
actual rains that were in the near-normal range. The yield indi-
cator showed that most farmers had obtained yields that were
close to their historical average. In this year, farmers who
reported using the forecast to make different decisions outper-
formed those who had not by an average of 18.7 per cent. The
difference was significant at a 90 per cent confidence level, using
both parametric and non-parametric statistical tests. Averaged
over the two years, farmers who reported using the forecast
outperformed those who had not by an average of 9.4 per cent,
a difference significant at a 95 per cent confidence level. These
data provided the most convincing evidence to-date that fore-
casts could benefit individual subsistence farmers.
The second quantitative finding was that workshop atten-
dance made a large difference in farmers’ use of the forecast. In
two of the communities, the data indicated that the farmers
who had attended the workshops represented a biased sample
of very good farmers, making it impossible to compare them
with those who had not attended the workshops. In the other
two communities, however, there did not appear to be a differ-
ence between the two groups, making a comparison possible.
The majority of farmers who had attended a workshop reported
using the forecast to make different decisions, whereas roughly
10 per cent of those who had not attended a workshop but had
heard the forecast through another channel reported using it
to make different decisions. Thus, workshop attendance
boosted forecast-use by a factor of five.
These results were the first of their kind, in that they showed
benefits from forecasts using a participatory dissemination
strategy, with a research methodology that allowed for robust
statistical tests. In these communities, which faced growing
conditions similar to those across much of the region, seasonal
climate forecasts made a profound difference to those farmers
who chose to use the information. Using the information,
however, is not easy, and a participatory communication strat-
egy was the major determinant of farmers’ using the
information. Timely and accurate seasonal climate forecasts
can help subsistence farmers – among the poorest of the poor
– but NMHS need to continue to work with other stakehold-
ers to communicate the information in ways that increase
farmers’ understanding of, and trust in, the information.
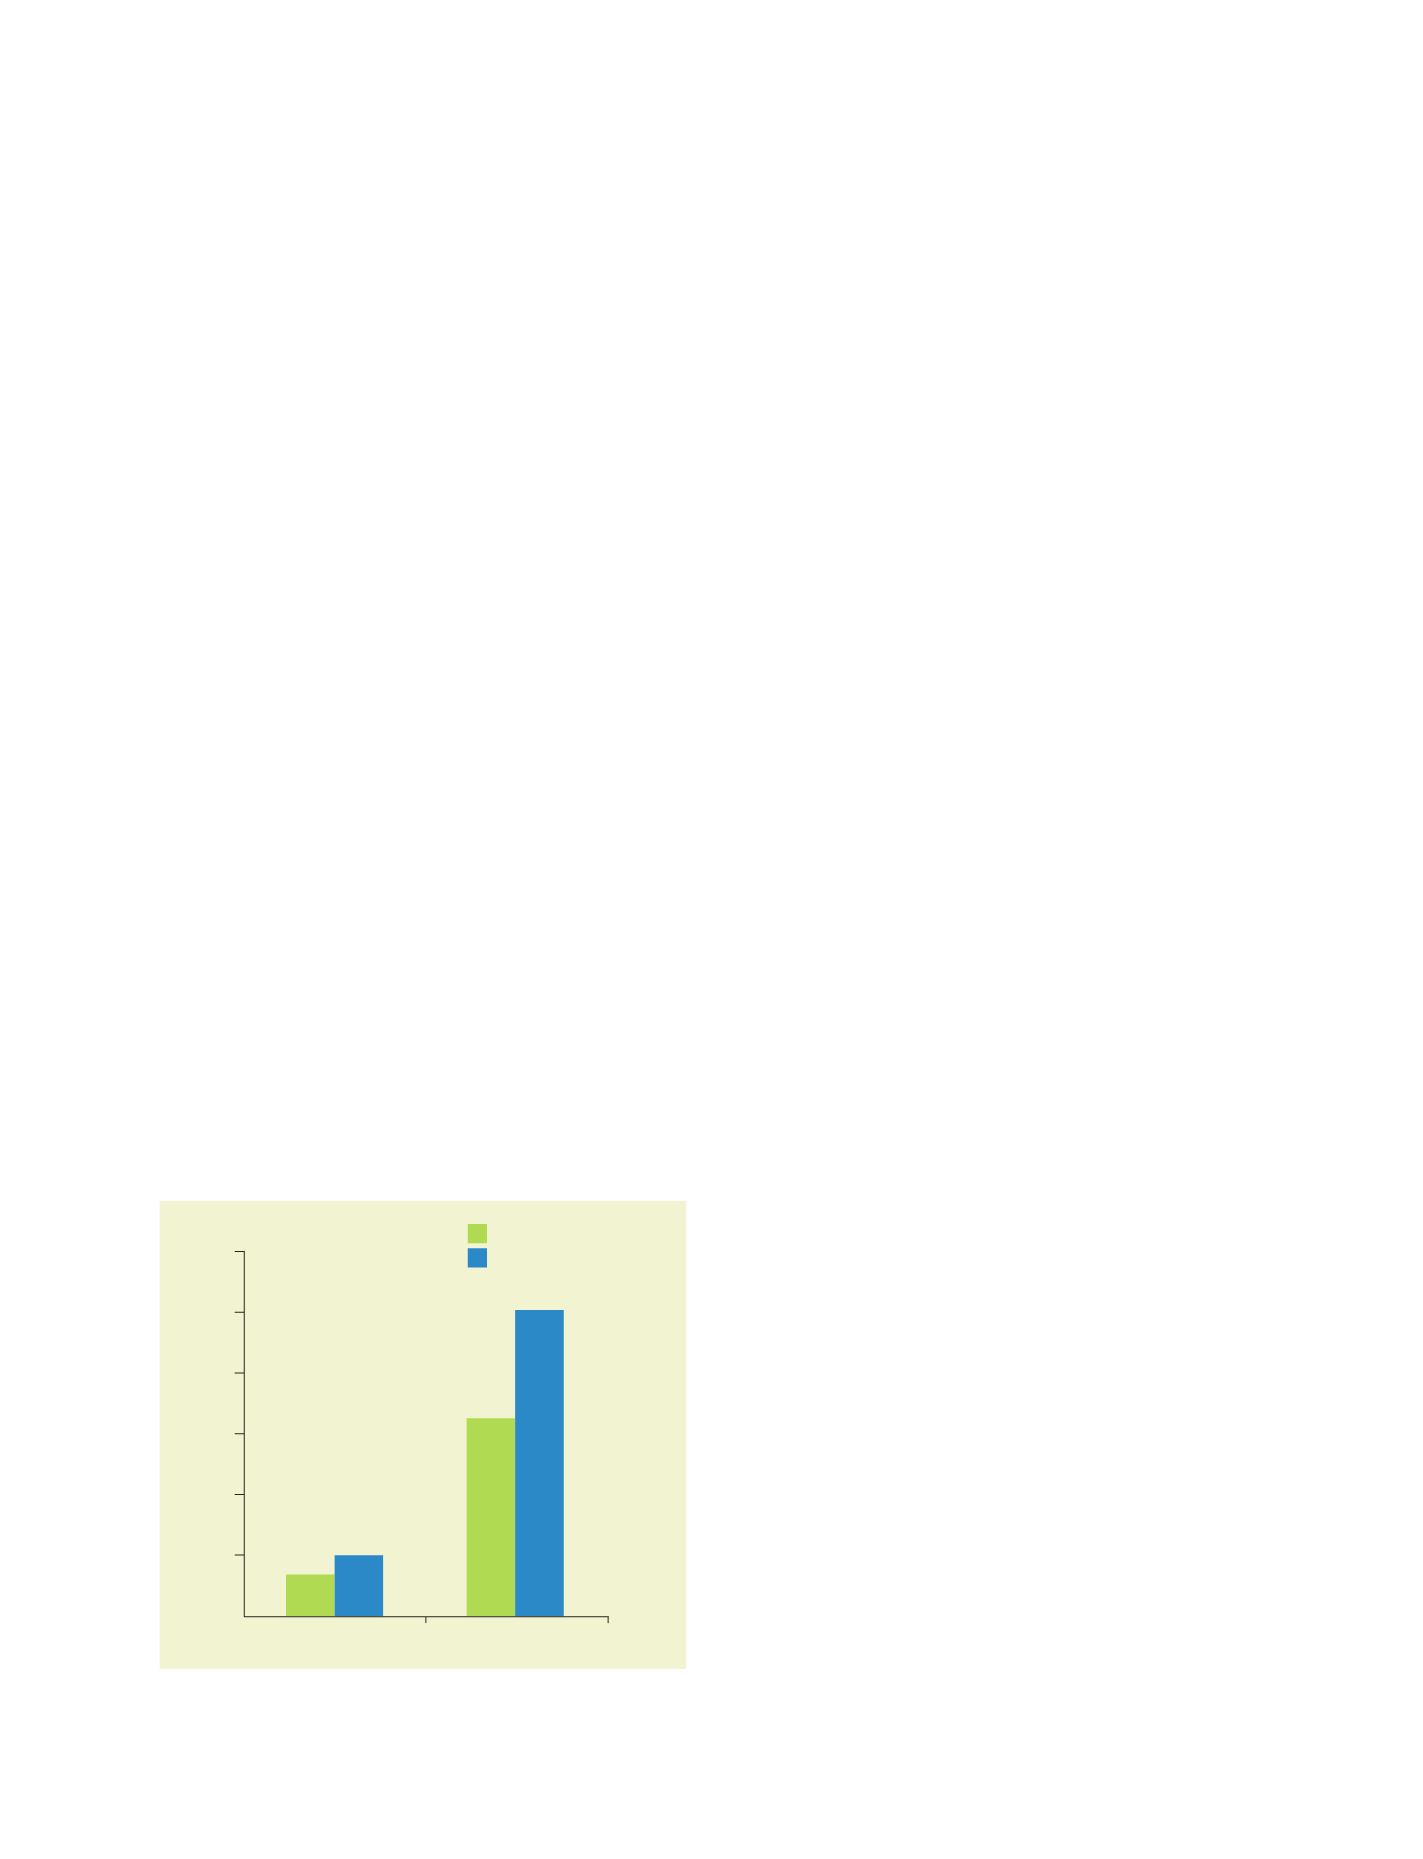
0
0.1
0.2
0.3
0.4
0.5
0.6
2002-03
2003-04
Average value of harvest indicator
Used forecast
Did not use forecast
Harvest indicator showing how farmers performed relative
to their own historical yields
Source: Patt, Suarez and Gwata, Proceedings of the National Academy of Sciences,
30 August 2005