


 69 / 218

rural community. It also helps to assess the current situation,
providing early indication of the need for contingency action or
drought relief.
Using monthly rainfall analysis, areas suffering from rainfall
deficiencies appear in the Drought Statement as well as the
Monthly Drought Review
. If the accumulated rainfall over three
successive months (six months for arid regions) was within the
lowest 10 per cent on record, a drought watch begins and the
region is highlighted. Consideration is also given to whether an
area is usually dry at that time of the year. There are two rainfall
deficiency categories:
• Severe rainfall deficiency exists where rainfall for three
months or more is in the lowest 5 per cent of records
• Serious deficiency lies in the next lowest 5 per cent, ie. the
lowest 5-10 per cent of historical records for three months
or more.
Allowing for seasonal conditions, the drought watch may
continue for many months and only ceases when plentiful rain-
fall returns. ‘Plentiful’ is defined as well above average rainfall for
one month, or above-average rainfall over a three-month period.
Rural productivity, especially in Queensland and New South
Wales, is linked to the behaviour of the Southern Oscillation.
An understanding of how the climate affects agriculture, and how
agricultural producers can better use climate information, is vital
to the sustainability of agricultural enterprises. To assist planning
and decision making across the agricultural arena, the Bureau’s
Silo Web site provides a rich source of meteorological and agri-
cultural data of particular interest to policy makers and farm
operators. The Silo Web site is supported by a number of other
state and federal agencies with expertise in agriculture and
primary production. Its objectives include:
• Providing a rich source of national meteorological and agri-
cultural data that is readily accessible to decision makers,
researchers and educationalists, particularly in the agricul-
tural area
• Developing a coordinated information service that will facil-
itate further adoption of climatic risk management
techniques by landholders and agribusiness
• Providing a framework to encourage future additions to the
agrometeorological data bank
• Establishing the collaborations required to ensure the
system remains operational beyond the term of the
research funding.
The Bureau has recently released a ‘Water and the Land’ Web
site which provides an integrated suite of information for
people involved in primary production and natural resource
management. The site brings together information from differ-
ent Bureau services and presents links in groups organized by
weather elements including rainfall, cloud, temperature, wind,
pressure, El Niño and La Niña, humidity, evaporation and
sunshine. Depending on the range of products available for the
group, long-term outlooks are listed first, followed by shorter-
term forecasts, latest weather, recent weather, averages, and
long-term trends.
One example of the Bureau’s seasonal forecasts being used to
fine-tune farming practices is in crop selection.
3
In April and
May, when the Southern Oscillation index (SOI) is negative, there
is a high chance of poor wheat yields and negative profits. But
sorghum in the summer following a negative SOI in April and
May often proves profitable. Farmers at Roma in Queensland
found sorghum more profitable than wheat during the El Niño
years of the 1990s and that a cutback in wheat area in these years
was profitable.
Meteorology and related fields such as hydrology and
oceanography, have applications at every level of government,
in all sectors of the economy and for every citizen. This is no
time for complacency. Greater pressure on water resources,
increased focus on sustainability and the likely impact of
climate change will continue to pose challenges for govern-
ments at all levels.
[
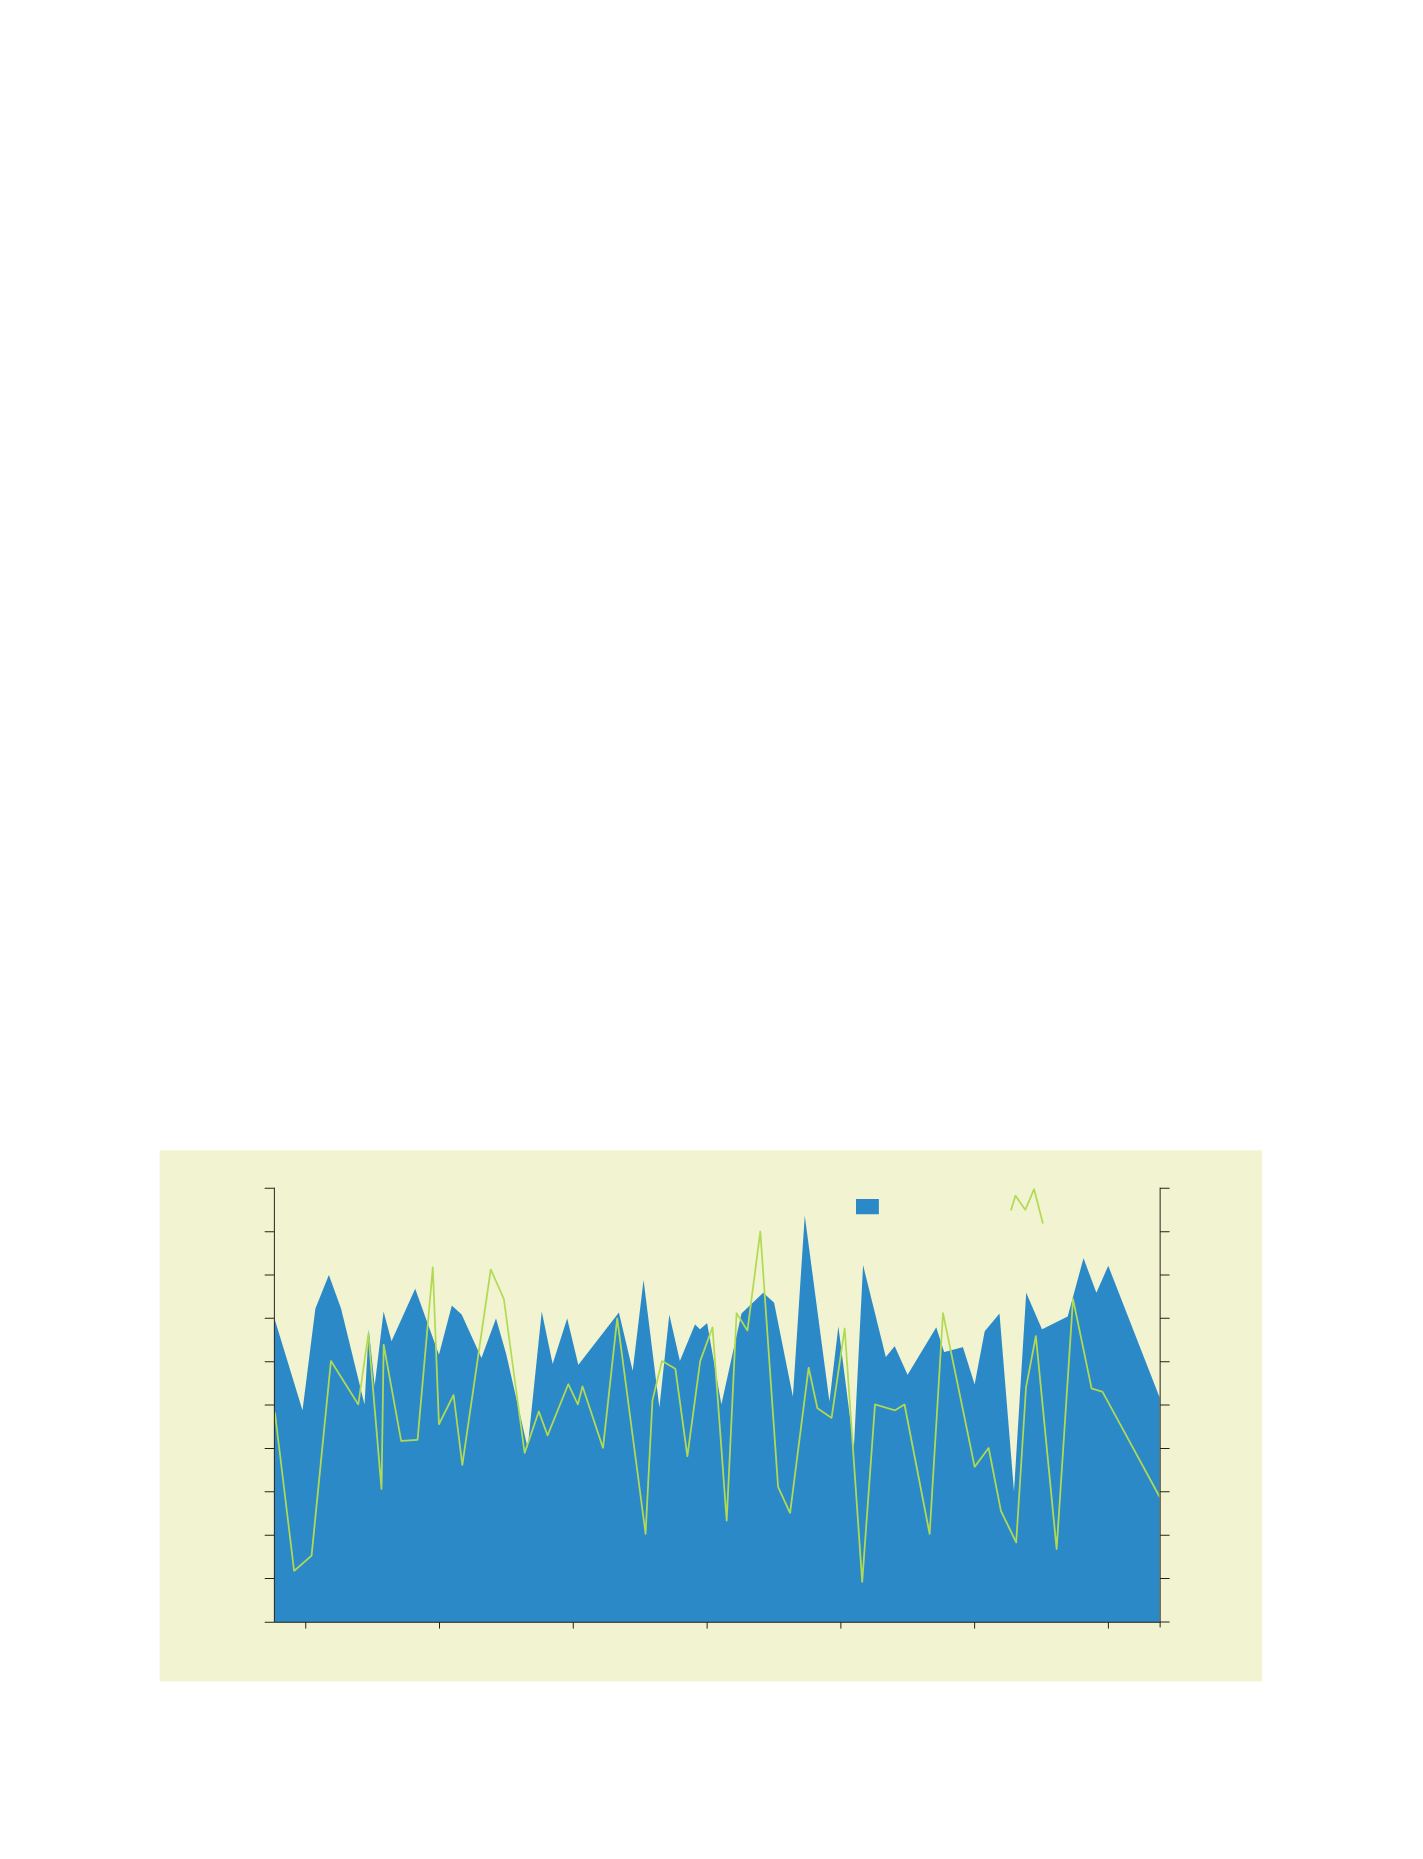
] 69
0.00
0.20
0.40
0.60
0.80
1.00
1.20
1.40
1.60
1.80
2.00
1940
1950
1960
1970
1980
1990
2000
Tonnes/Hectares
-25.0
-20.0
-15.0
-10.0
-5.0
0.0
5.0
10.0
15.0
20.0
25.0
SOI (June-September)
Year
Wheat Yield
SOI
Australia’s annual wheat yields and the Southern Oscillation Index (SOI) from 1939 to 2002.
Generally speaking an
El Niño
is considered to be underway when the SOI remains less than -10 for 5 months or more.
Source: Bureau of Meteorology