


 139 / 210

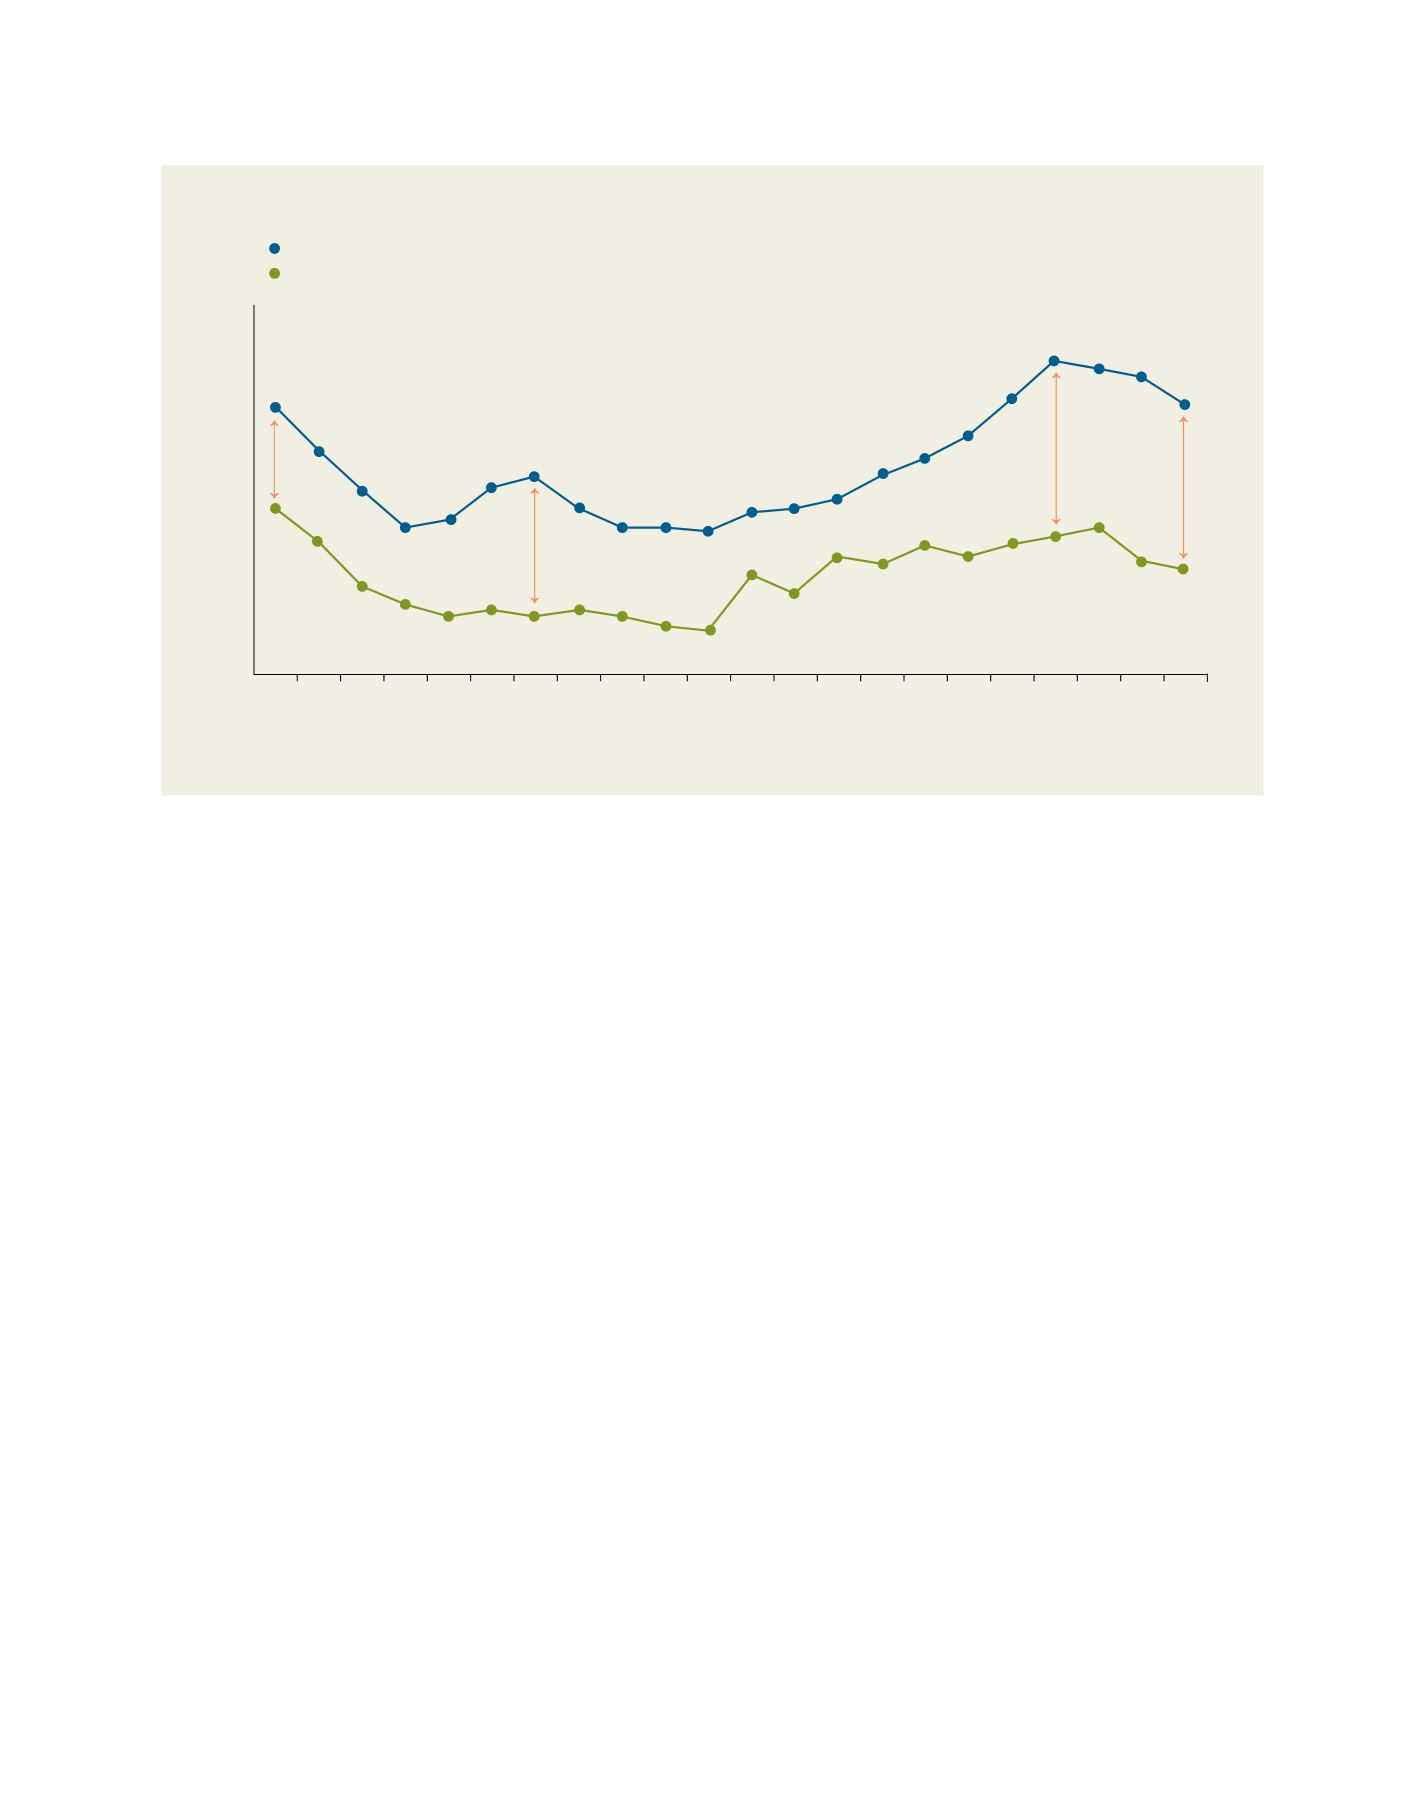
Compared to 1989, the standard of living of the upper medium segment didn’t increase much in 2009-2011, while those with low wages are even poorer
[
] 137
C
onfronting
F
amily
P
overty
Two medium salaries and two allocations for children, per cent from standard of living
Two minimal salaries and two allocations for children, per cent from minimal standard of living
1990
Year
Per cent
0
60
120
180
1995
2000
2005
JUN
2010
AUG
2010
133
107
88
71 75
91
96
80
73 73 71
80 81
86
95
104
116
135
153 151 148
134
82
51
64
42
32
27 30 27 30 27
22 21
46
39
57 51
61
58
61 64
70
54 52
69
89
72
Standard of living for the active family with two employees with two children
Source: IQLR calculations, Romanian Academy 2012
a difference between the evolution of families with medium
wages and those with low wages compared to the minimal
decent standard of living. The gap between them increased
from 51 per cent in 1990 to 69 per cent in 1996, 89 per cent
in 2008 and 72 per cent in 2010.
The dynamics of the standard of living for the active family
from the upper medium segment (four people, two average
wages and two allocations for children) show:
• three periods of decrease: 1991-1993, 1997-2000 and 2009
to the present day
• a long period (13 years, 1992-2004) when the standard of
living was below the minimal level
• the same standard of living in 2010 as in 1990 for the
average family in the upper segment.
For the active family from the lower medium segment (two
minimal wages and two allocations for children), standard of
living dynamics show several distinctive evolutionary traits:
• the standard of living is consistently and significantly
below the minimal level
• throughout the transition years it was substantially below
the level of 1990
• the highest levels were recorded at the beginning and end
of the post-revolutionary period: 1990 (82 per cent), 2008
(64 per cent) and 2009 (70 per cent), while the minimal
levels show a state of severe poverty with 27 per cent in
1994 and 20 per cent in 2000.
A large majority of old people are covered by the pensions
system. Data for past years show a low risk of poverty for
this category, even if it is above the European average. The
relative welfare of pensioners is explained by the certitude
of an income; the existence of two pensions; ownership of
the dwelling acquired in the past; accumulation of household
appliances (which allow the full use of incomes for current
consumption); and a reasonable health-care system.
The future elderly have a more challenging perspective because
they will be covered less by social insurance and pensions. Some
will not have a pension at all, while many will have low pensions
due to few years of employment and low social contributions.
Many will suffer from the lack of health care insurance.
Although there was a policy to support families with chil-
dren, it proved to be completely unsatisfactory. Children
represent a very high risk of poverty, the highest among EU
countries. Generally, children from employed families with
average wages or higher have reasonable conditions of living.
However, since most incomes are low, the appearance of a
child substantially affects the family’s standard of living, with
the children suffering the poverty of their parents.
Single parent families also run a high risk of poverty. These
families, and families with more than three children, are
condemned to severe poverty. The children are abandoned,
often in the street; other children are abandoned in institu-
tions, many of them underfinanced and improperly managed
because of the lack of social services.
State allocations for children were supposed to play an
important compensating role under the conditions of collec-
tive precariousness. The official data on the standard of living
show that in 2009, more than half of the families with two
adults and three or more children and more than a third of
single parent families live in relative poverty (56.3 per cent
and 35.3 per cent respectively).
3