


 140 / 156

NDVI Anomaly (%)
-100 -80 -60 -40 -20 0 20 40 60 80 100
NDVI Anomaly (%)
-100 -80 -60 -40 -20 0 20 40 60 80 100
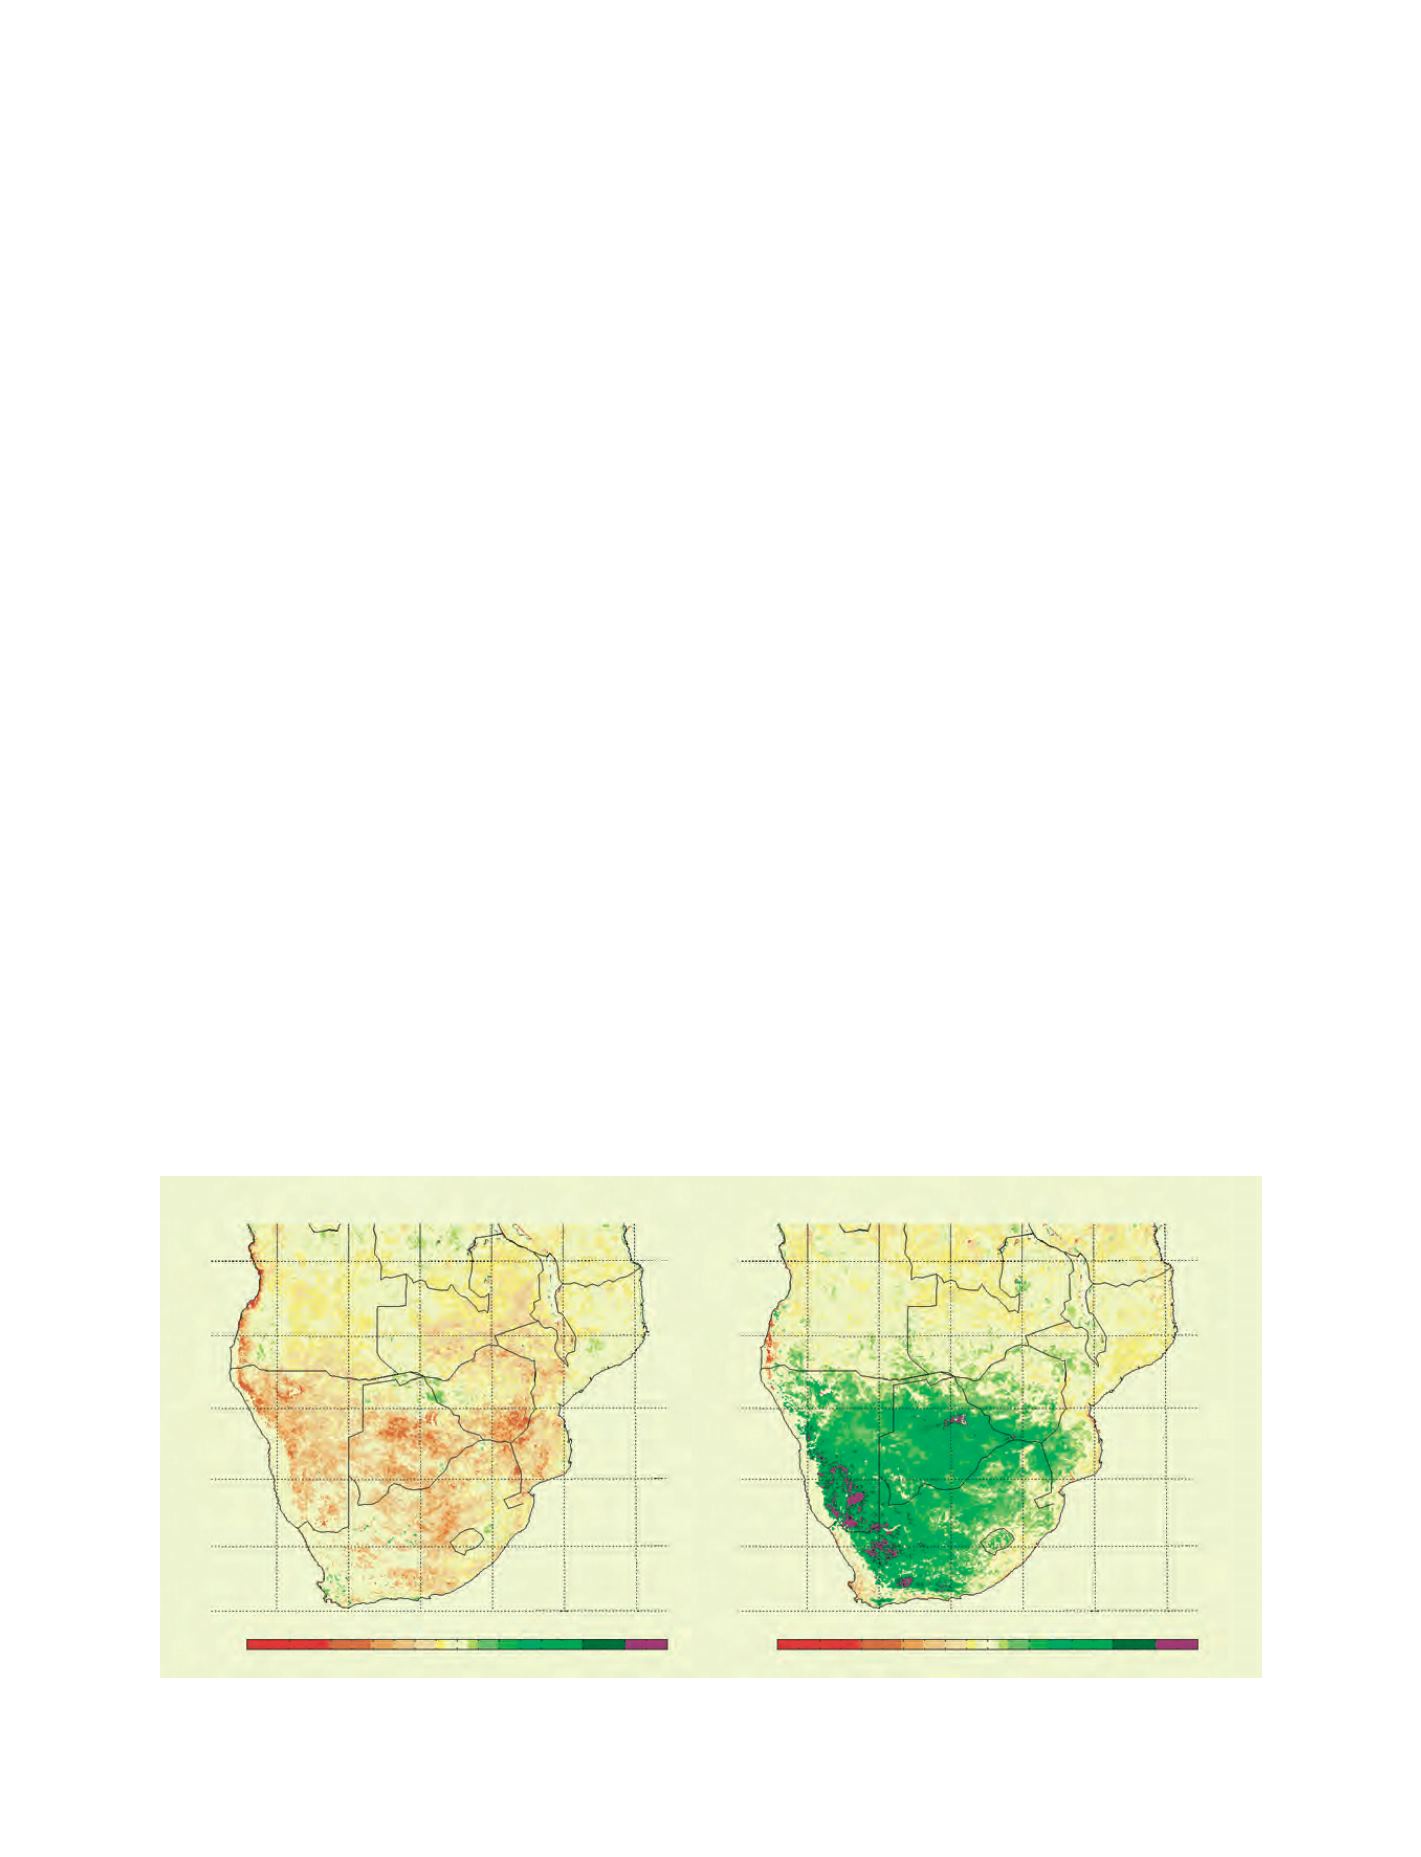
Growing Season NDVI Anomaly (Mar-May 1992)
Growing Season NDVI Anomaly (Mar-May 2000)
-10
-15
-20
-25
-30
-35
-10
-15
-20
-25
-30
-35
15
20
25
30
35
40
15
20
25
30
35
40
Source: NASA GSFC Earth Science Divison
Growing season normalized difference vegetation index (NDVI) comparisons for two seasons
[
] 140
various national, regional and international organizations to
monitor drought conditions across the continent. These measure-
ments of vegetation are important in mapping both the severity
and extent of drought conditions, providing critical information
on where food aid can be targeted to the most vulnerable locales.
The development of such historical, remotely-sensed measure-
ment has created a long time series baseline fromwhich the scientific
community can begin to understand the spatial and temporal
frequency of drought patterns, validate forecast models and provide
critical information to a variety of end users to mitigate the nega-
tive impacts of drought on society. NASA can contribute to these
efforts by developing a continuous and systematically calibrated
time series of vegetation measurements from heritage instruments
such as NOAA-AVHRR, LANDSAT, currently available data from
Terra/Aqua MODIS, and continuing into the NPP-NPOESS era.
The climate variability over Africa is exemplified by episodic
flooding and severe weather events. Such extreme variations are at
different time scales (such the prolonged droughts of the Sahel
region) and inter-annual variability (e.g. the patterns of rainfall
departures over Southern Africa and periodically over Eastern
Africa). Prevailing patterns of sea surface temperatures, atmos-
pheric winds, regional climate fluctuations in the Indian and
Atlantic Oceans, and the El Niño Southern Oscillation (ENSO)
phenomenon all have a combined impact on climate variability
over most of the continent. ENSO in particular manifests itself
over Africa in different ways, with El Niño (La Niña) resulting in
drought (wet) conditions over Southern (Eastern) Africa. During
the 1991-1992 period, the entire Southern Africa region was
affected by a large-scale drought associated with the 1991-1992 El
Niño event, resulting in large-scale crop failures and water short-
ages. In contrast, the 1999-2000 La Niña event was associated
with numerous severe land-falling cyclones and large-scale flood-
ing across the region. The recent large-scale drought in East Africa
in 2005-2006 was associated with a recent La Niña event.
Floods and droughts in Southern and Eastern Africa are linked
to the fluctuations in frequency-magnitude relationship of the
climatic fluxes over the region, attributed to the anomalous
behavior of the intertropical convergence zone (ITCZ) and sea-
surface temperatures (SSTs) over the Indian Ocean, induced by
the ENSO. A variety of NASA remotely-sensed measurements
of vegetation, SSTs, winds and rainfall can be used to study and
understand the spatial and temporal frequency characteristics
of floods and other extreme events over Africa to reduce nega-
tive impacts on agriculture, health and water supplies.
Sustainability for water resource management
Water resource management with goals of sustainable devel-
opment is aimed at providing safe and plentiful water for
human consumption and use with sound environmental prac-
tices. A successful programme for the sustainable development
of water resources depends on two critical factors. The first is
access to modern models, technical analysis and integration
techniques. The second is access to basic meteorological, envi-
ronmental, and hydrological data. The lack of basic data means
that water resources managers are unable to implement modern
technology for achieving sustainability.
A number of water resources management capabilities have been
developed and implemented by US and other water agencies. These
are in the form of decision support tools (DSTs) that are used for
water resources planning and management. The usefulness of these
DSTs is not limited to the region where they were developed and
validated; however, the one factor preventing the adaptation of
these systems commonly used in the developed world is the lack
of sufficient data to drive them. These DSTs are available for use
almost anywhere in the world if these data problems can be over-
come. Satellite-measured hydrological variables, along with
modelling and remote sensing science products, have the potential
to overcome these data problems and provide water management
data for a region with little or no hydrometeorological data.
Remotely-sensed data and data products from data assimilation
schemes are capable of producing variables needed for sustain-
able water resources development such as surface water balance,
soil water balance, reservoir storage, surface temperature and vege-
tation type. These are the common hydrologic variables that are
needed in any water resources management scheme. For example,
flood preparedness, early warning and forecasting, post-flood char-