


 130 / 156

[
] 130
A
CATEGORY FIVE
hurricane makes landfall with its eye just
southwest of Galveston; a category three hurricane makes
landfall in New York City; a category five hurricane strikes
New Orleans. These scenes may seem far-fetched, but they are closer
to reality than we think. How ready are we for the next big event?
Eight million people live in New York City alone; nearly 20
million people live in the greater metropolitan region. Many of
these people live on barrier islands, coastal land, reclaimed
wetlands and the landfill that makes up much of Lower
Manhattan, enough people to make this a catastrophe of propor-
tions greater than Katrina.
NASA’s strategy to help the nation, and the world, prepare for
such a catastrophe is nestled in its strategy for applied sciences
to benefit society. Backed by years of research in climate change,
solid earth and atmospheric sciences, NASA has the tools avail-
able to study the Earth’s system, understand the changes, and
predict future changes. NASA has taken a systems engineering
approach to using its research and technology to enhance deci-
sions support. These efforts coincide with the US Government’s
endeavour to develop a ten-year strategy for disaster reduction.
Members of the Office of Science Technology and Policy (OSTP)
Subcommittee on Disaster Reduction (SDR) collaborated with
scientists and engineers worldwide to identify a suite of ‘grand
challenges’ for disaster reduction. This article presents six such
challenges and provides a framework for prioritizing the related
federal investments in science and technology. Addressing these
grand challenges will improve America’s capacity to prevent and
recover from disasters, thus fulfilling its commitment to reducing
the impacts of hazards and enhancing the safety and economic
wellbeing of every individual and community. NASA plays an
important role in implementing these grand challenges.
NASA has a history of earth observing satellites that have bene-
fited the hurricane response and recovery community. The
Tropical Rainfall Measuring Mission (TRMM), Terra, Aqua, and
QuikScat have been around for a number of years, providing
valued input to models that predict the strength and path of hurri-
canes and tropical storms. The US National Oceanic and
Atmospheric Administration (NOAA) has stated that the
Atmospheric Infrared Sounder (AIRS) instrument on Aqua alone
has improved hurricane prediction significantly. The improve-
ment in forecast skill at five days is equivalent to gaining a four-
or five-hour extension of forecast capability. While this may seem
small, it is quite significant when compared to the rate of general
forecast improvement over the past decade. A four- to five-hour
increase in forecast range normally takes between 1.5 and 2 years
to achieve.
The 2005 hurricane season will long be remembered both for
the record-breaking number of early storms and for the emer-
gence of a powerful category 5 hurricane in the central Gulf of
Mexico – Hurricane Katrina. This hurricane began as a tropical
depression in the central Bahamas on the afternoon of 23 August
2005, before making landfall just south of Fort Lauderdale along
the southeast coast of Florida on the evening of 25 August as a
category 1 hurricane.
After coming ashore, Katrina cut southwestward across south-
ern Florida. The relatively short amount of time the centre spent
over land, combined with the wet marshy composition of the
Florida everglades, kept Katrina from weakening all that much.
As a result, Katrina quickly regained hurricane status after emerg-
ing into the Gulf of Mexico, becoming a category 1 storm on the
Are we ready for the next big event?
NASA’s strategy for Earth observations and
solutions for society
Stephen D. Ambrose, Program Manager for Disaster Management,
Applied Sciences Program, NASA Headquarters, Washington, DC
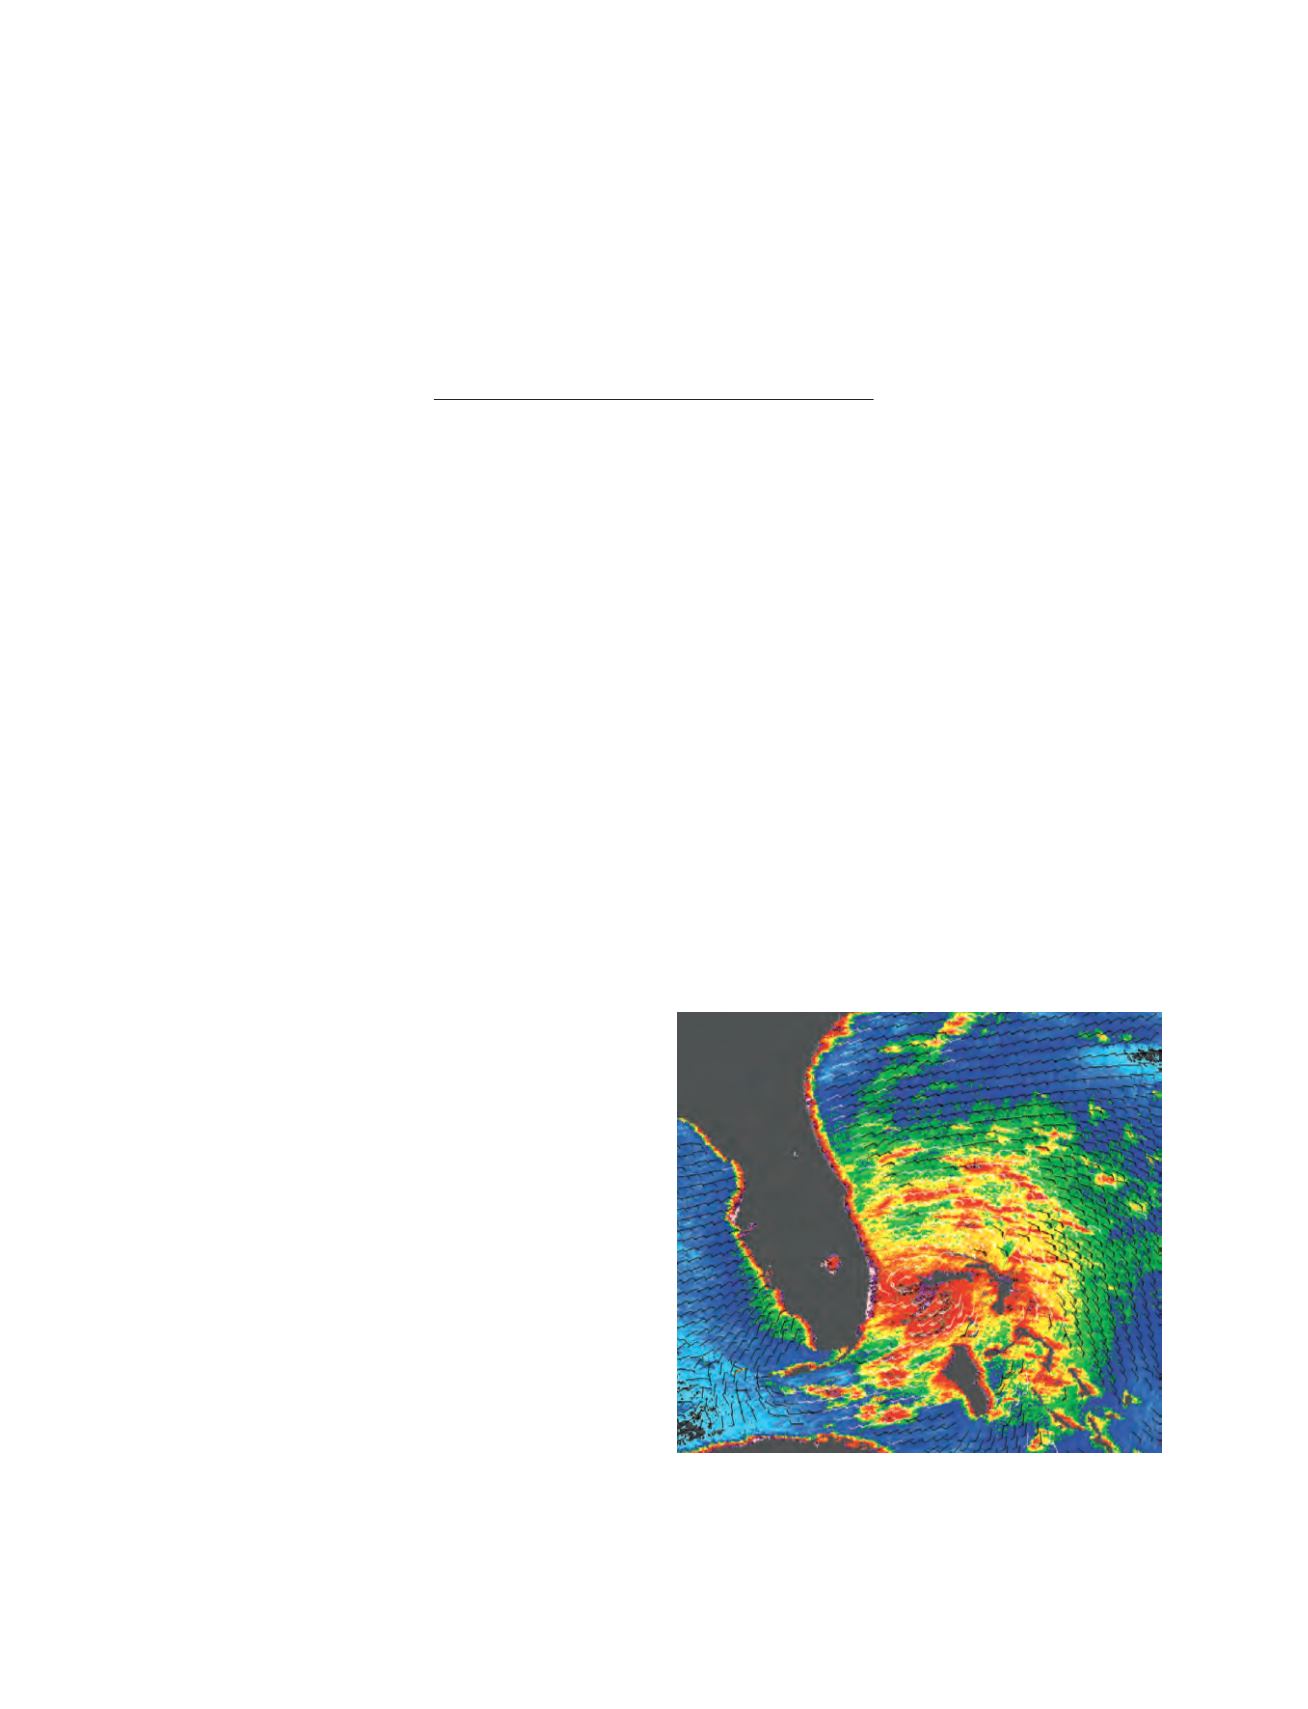
Tropical Storm Katrina as observed by NASA’s QuikScat satellite on 25
August 2005, at 0837 hours UTC (0437 hours in Florida). Wind speed
is depicted in colour and wind direction with small barbs. White barbs
point to areas of heavy rain. The highest wind speeds, shown in purple,
surround the centre of the storm
Image: NASA