


 131 / 156

morning of the 26 August. Conditions in the Gulf, however, were
favourable for development and Katrina began to intensify.
By the evening of 26 August, Katrina was a category two storm
as it continued to move slowly west-southwest in the southeast-
ern Gulf of Mexico. On the morning of 27 August, Katrina became
a category 3 storm with maximum sustained winds reported at
100 knots (115 mph) by the National Hurricane Center (NHC)
Tropical Prediction Center (TPC). The central pressure continued
to drop throughout the day, however, and the storm began to
shift to a more west-northwesterly direction.
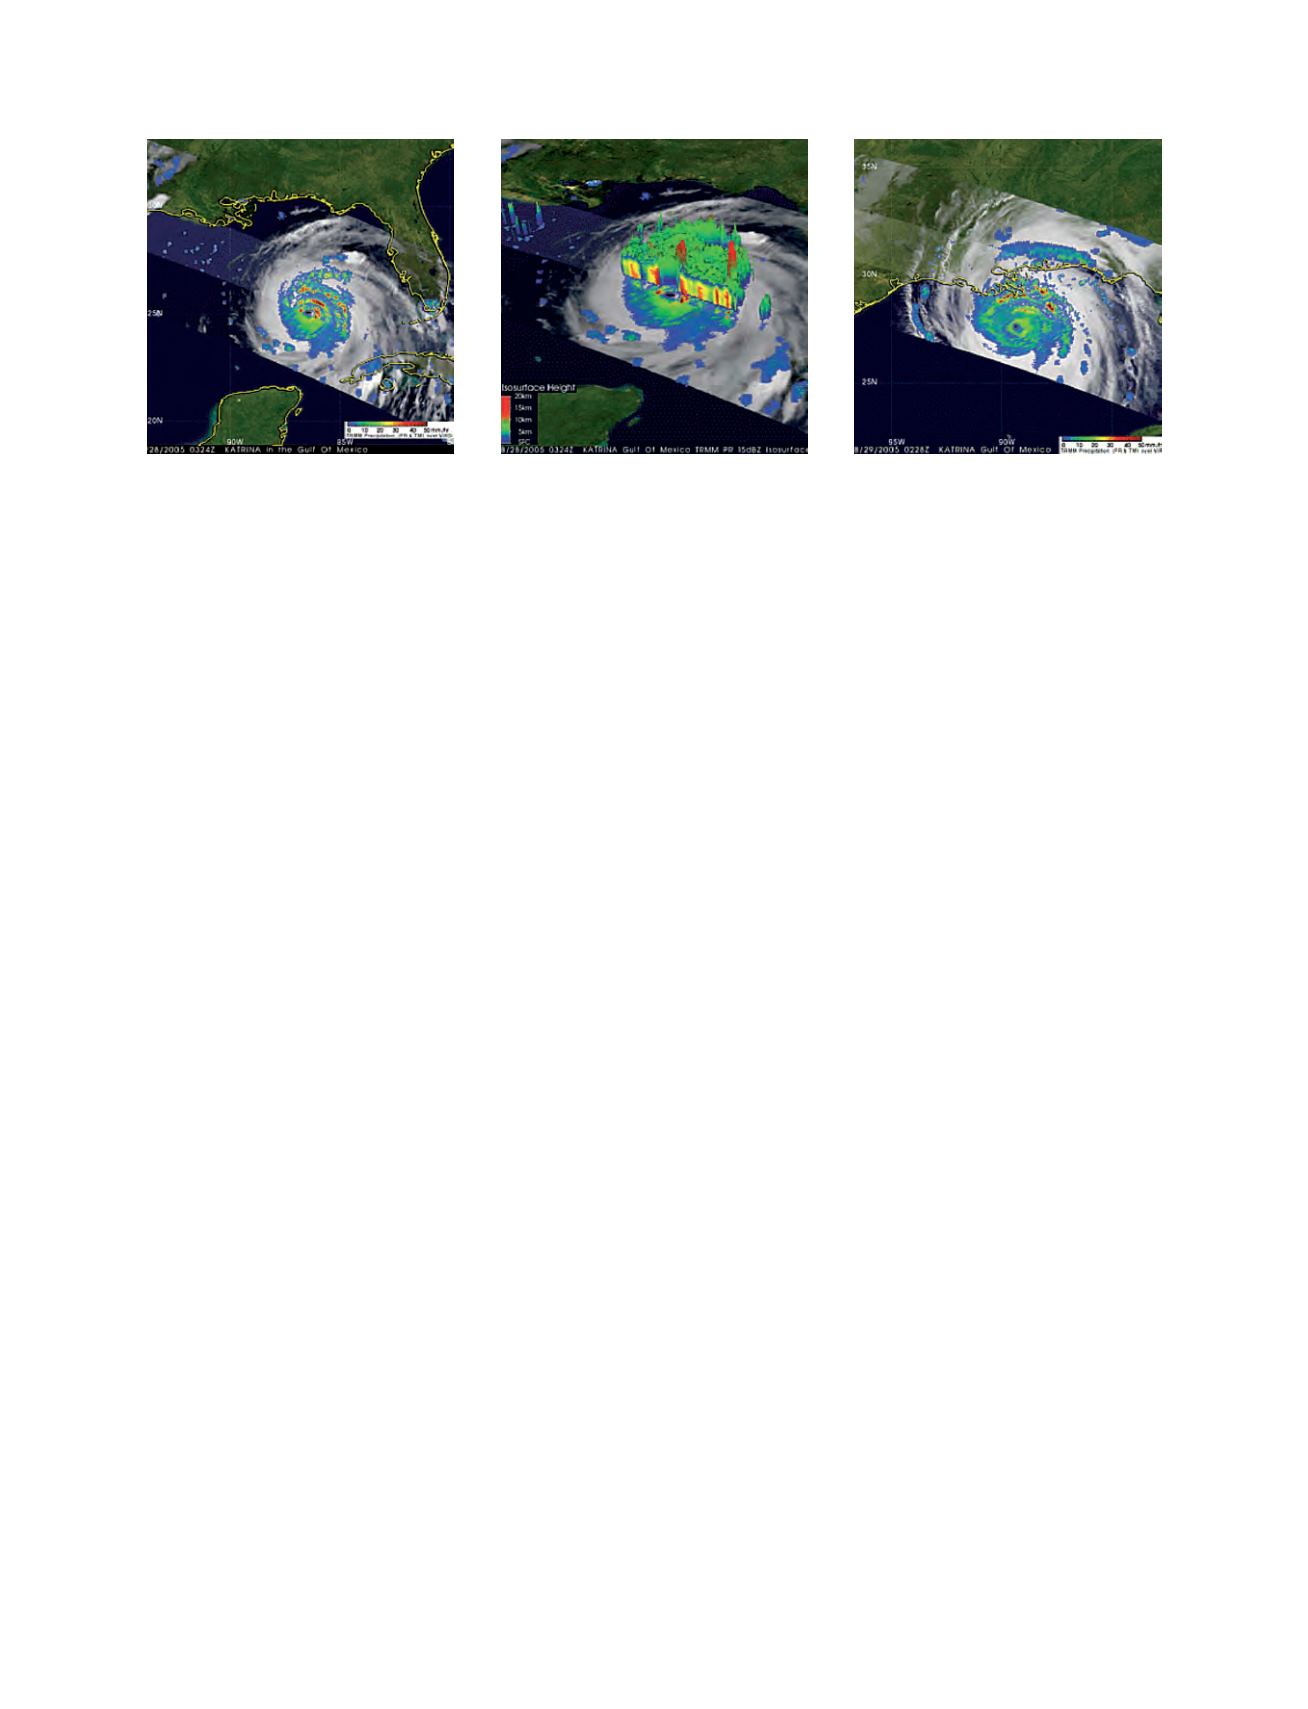
In November 1997, the TRMM satellite was launched to
measure rainfall over the global tropics. However, TRMM has also
shown itself to be a valuable instrument for observing tropical
cyclones, revealing Katrina from varying perspectives as shown in
the three images above.
The first image shows the horizontal distribution of rain inten-
sity within Katrina as obtained from TRMM's sensors. Rain rates
in the central portion of the swath are from the TRMM precipi-
tation radar (PR), the only radar capable of measuring
precipitation from space. The PR is able to provide fine resolution
rainfall data and details on the storm’s vertical structure. Rain
rates in the outer swath are from the TRMM Microwave Imager
(TMI). The rain rates are overlaid on infrared (IR) data from the
TRMM Visible Infrared Scanner (VIRS). At the time of the image,
Katrina was still a category 3 storm with maximum sustained
winds reported at 100 knots (115 mph). TRMM reveals that
Katrina has a closed eye surrounded by concentric rings of heavy
rain (red areas) that are associated with outer rain bands. The
intense rain near the core of the storm indicates where heat,
known as latent heat, is being released into the storm. This latent
heat release is what drives the storm’s circulation.
In the second of the three images, the vertical height of the
isosurface (15 dBZ) is determined by the height of precipitation-
sized particles as measured by the TRMM PR. Two isolated tall
towers (in red) are visible: one in an outer rain band and the other
in the northeastern part of the eyewall. This area of deep convec-
tion in the eyewall is associated with the area of intense rainfall
there. The height of the eyewall tower is 16km. Towers this tall
near the core are often an indication of intensification – this was
true in the case of Katrina, which became a category 4 storm soon
after the image was taken.
During the early morning hours of 28 August (local time),
Katrina’s central pressure continued to drop, and the storm inten-
sified into a powerful category 5 hurricane. By 1100 hours that
morning, Katrina’s sustained winds reached an unbelievable 175
mph! At 1755 hours UTC (1355 hours local time), a NOAA hurri-
cane hunter aircraft measured a central pressure of 902 mb, the
fourth lowest ever recorded in the Atlantic Basin. Katrina now turned
more to the northwest, in response to a weakness in the subtropi-
cal ridge to the north and an approaching trough from the west.
In the third image, the centre of Katrina does not fall within the
PR swath. However, the large eye of the storm is clearly visible
via the TMI, by the large ring of moderate-intensity rain that is
visible by the green annulus. The first outer rain bands with
embedded areas of heavy rain (red areas) are already impacting
the coast in southeastern Louisiana. At the time of this image,
Katrina was at category 5 intensity, with maximum sustained
winds measured at 140 knots (161 mph) by the NHC.
Katrina initially made landfall at 0010 hours UCT (0610 hours
CDT) south of Buras, Louisiana, along the Mississippi delta as a
strong category four storm. The eye eventually crossed the coast-
line again along the Mississippi-Louisiana border with the most
dangerous part of the storm, the eastern eyewall, hitting along
the same part of the Mississippi coastline that was wiped out by
Hurricane Camille back in 1969.
Tropical Storm Katrina was observed by NASA’s QuikScat satel-
lite on 25 August 2005, at 0837 hours UTC (0437 hours in
Florida). At this time, the storm had sustained winds of 80 kilo-
metres per hour (50 mph; 43 knots). It did not yet appear to have
reached hurricane strength.
However, the greater danger lay not with Katrina’s winds, but
with her rains. At this point the storm was moving slowly, at just
13 km/h (8 mph), and was expected to slow as it moved over
land. The NHC warned that Katrina’s heavy rains would linger
longer over one area, dumping 15-25 cm (6-10 inches) of rain
over Florida and the Bahamas and possibly up to 38 cm (15
inches) in some regions.
Measurements of Katrina’s wind strength show sustained winds
similar, but not identical, to those shown by the QuikScat obser-
vations. This is because the power of the storm makes accurate
measurements difficult. The scatterometer sends pulses of
microwave energy through the atmosphere to the ocean surface,
and measures the energy that bounces back from the wind-rough-
ened surface. The energy of the microwave pulses changes
depending on wind speed and direction, giving scientists a way
to monitor wind around the world.
[
] 131
The first two images, taken by TRMM at 0324 hours UTC on 28 August 2005, show aerial and 3D-cutaway views of Katrina, about to become a
category 4 hurricane in the central Gulf of Mexico. The third image, taken at 0229 hours UTC on 29 August, shows Katrina bearing down on
the north-central Gulf Coast
Images: NASA